%matplotlib inline
from d2l import torch as d2l
import numpy as np
from scipy import integrate, optimize28.3 Divergences and Distances Between Distributions
Section 28.1 ended with a difficulty: the KL divergence becomes infinite as soon as a model gives zero probability to an outcome that occurs. A classifier rarely meets it, because a softmax never outputs an exact zero. A generative network that turns a low-dimensional noise vector into an image meets it often. It is trained by driving some distance between its distribution and the data distribution toward zero, yet its samples lie on a thin surface in image space that can miss the data altogether. This section asks how else two distributions can be compared, and which comparisons notice when a model is close but not yet right.
The smallest case already shows what can go wrong. Let the data sit at a single point, \(P = \delta_0\), and let the model’s samples sit at a single point a distance \(d\) away, \(Q = \delta_d\). A model at \(d = 0.01\) is nearly right and a model at \(d = 100\) is far off, so a useful loss should tell them apart. Table 28.3.1 shows what five common comparisons report. Most of them are defined later in the section, and for now only the pattern matters.
| comparison | \(d = 0.01\) | \(d = 1\) | \(d = 100\) |
|---|---|---|---|
| KL divergence \(D_{\textrm{KL}}(P\|Q)\) | \(\infty\) | \(\infty\) | \(\infty\) |
| Jensen–Shannon divergence | \(\log 2\) | \(\log 2\) | \(\log 2\) |
| total variation distance | \(1\) | \(1\) | \(1\) |
| maximum mean discrepancy \(\textrm{MMD}^2\) | \(0.0001\) | \(0.79\) | \(2.00\) |
| Wasserstein distance \(W_1\) | \(0.01\) | \(1\) | \(100\) |
The KL divergence of Section 28.1 is infinite in every column. The next two rows are bounded relatives of KL, defined below, and the last two are new. Three of the five rows do not change with \(d\) at all. The Jensen–Shannon row fixes the loss of the original generative adversarial network (GAN) at its best discriminator, which is \(2\,\textrm{JS} - \log 4\) and therefore zero in every column. A loss that does not change with the generator’s parameters has zero gradient, so the generator cannot learn which way to move.
The point masses are an extreme case, but in ordinary cases too, what a divergence compares decides how a model trained with it behaves. A maximum-likelihood fit spreads mass over the empty valley between two modes. A loss built from the slopes of log-densities cannot tell whether two distant modes hold \(70\%\) and \(30\%\) of the mass or the reverse.
To compare two distributions we must therefore choose what to compare, and that choice fixes what we must be able to compute and what the comparison can detect. There are four choices. Ratio methods compare the two densities point by point through \(p/q\), and they need both densities. Test-function methods ask how differently the two distributions average a class of functions, and they need only samples. Transport methods measure the cost of the cheapest way to move one distribution’s mass onto the other, and they see the geometry of the space. Score methods compare the slopes of \(\log p\) and \(\log q\), and they never see a normalizing constant.
KL is the first ratio method, and minimizing it is maximum likelihood. This section builds the other families, connects them by inequalities, and ends by matching common training objectives to the comparisons they make. How accurately any of them can be estimated from a finite sample stays open.
As in Section 28.1, every logarithmic quantity is in nats (natural logarithms); bits are a fixed \(\ln 2\) rescaling. Only the divergences built from a logarithm carry this unit: KL, reverse KL and Jensen–Shannon are in nats. Total variation, \(\chi^2\) and squared Hellinger contain no logarithm and are dimensionless, and transport distances carry the units of the sample space itself. The numerical examples use NumPy and SciPy.
The section uses a dozen symbols, each with one meaning; the chapter’s full notation table is in Section 28.1. The distributions \(P\) and \(Q\) have densities or probability mass functions \(p\) and \(q\), and \(u = p/q\) is their density ratio. The letter \(f\) is reserved for the convex generator of an f-divergence, \(T\) for a critic and \(g\) for a test function. A coupling of \(P\) and \(Q\) is \(\gamma\), the score of \(P\) is \(s_P\), the Hellinger distance is \(d_{\mathrm{H}}\), and \(\varepsilon\) is the entropic regularizer of optimal transport.
%matplotlib inline
from d2l import tensorflow as d2l
import numpy as np
from scipy import integrate, optimize%matplotlib inline
from d2l import jax as d2l
import numpy as np
from scipy import integrate, optimize%matplotlib inline
from d2l import mxnet as d2l
import numpy as np
from scipy import integrate, optimizeThe following cell computes the table. It treats \(\delta_0\) and \(\delta_d\) as probability vectors \((1, 0)\) and \((0, 1)\) on the two points \(\{0, d\}\) and evaluates each comparison from the definition that this section develops; for now, read only the output.
def kl_div(p, q):
    """D_KL(P||Q) on a finite support: 0 log 0 = 0, and inf if q = 0 < p."""
    s = p > 0
    with np.errstate(divide='ignore'):
        return np.sum(p[s] * np.log(p[s] / q[s]))

def five_comparisons(atoms, p, q, ell=1.0):
    """KL, JS, TV, RBF MMD^2 and W1 between pmfs p, q on sorted atoms."""
    m = (p + q) / 2                                   # the mixture for JS
    K = np.exp(-(atoms[:, None] - atoms[None, :]) ** 2 / (2 * ell ** 2))
    F_gap = np.abs(np.cumsum(p) - np.cumsum(q))[:-1]  # |F_P - F_Q| between atoms
    return {'KL': kl_div(p, q), 'JS': (kl_div(p, m) + kl_div(q, m)) / 2,
            'TV': np.abs(p - q).sum() / 2, 'MMD^2': (p - q) @ K @ (p - q),
            'W1': np.sum(F_gap * np.diff(atoms))}

delta_0, delta_d = np.array([1.0, 0.0]), np.array([0.0, 1.0])  # on atoms (0, d)
for d in (0.01, 1.0, 100.0):
    vals = five_comparisons(np.array([0.0, d]), delta_0, delta_d)
    print(f'd = {d:6}: ' + '  '.join(f'{k} {v:.4g}' for k, v in vals.items()))
d = 0.01: KL inf JS 0.6931 TV 1 MMD^2 0.0001 W1 0.01
d = 1.0: KL inf JS 0.6931 TV 1 MMD^2 0.7869 W1 1
d = 100.0: KL inf JS 0.6931 TV 1 MMD^2 2 W1 100Three comparisons are the same for every \(d \neq 0\), and two move with \(d\). The rest of the section explains both behaviors and what each comparison requires us to compute.
28.3.1 Divergences and Metrics
Before building any of the five comparisons, we fix the least that a “distance between distributions” must satisfy.
A divergence is a function of two distributions that is non-negative and vanishes only when they agree:
\[ D(P, Q) \geq 0, \qquad D(P, Q) = 0 \quad \textrm{if and only if} \quad P = Q. \]
Nothing else is required. A metric, like the norms of Section 1.3, must in addition be symmetric, \(D(P, Q) = D(Q, P)\), and satisfy the triangle inequality, \(D(P, R) \leq D(P, Q) + D(Q, R)\). The KL divergence is a divergence but fails both extra conditions. To see the failures with numbers we display the KL divergence between two one-dimensional Gaussians, which Section 28.1 derives:
\[ D_{\textrm{KL}}\big(\mathcal{N}(\mu_1, \sigma_1^2) \,\big\|\, \mathcal{N}(\mu_2, \sigma_2^2)\big) = \log\frac{\sigma_2}{\sigma_1} + \frac{\sigma_1^2 + (\mu_1 - \mu_2)^2}{2\sigma_2^2} - \frac{1}{2}. \tag{28.3.1}\]
The first term is the log of the width ratio. The second measures how much of the first distribution’s spread and offset the second one’s width must absorb, and the \(-\tfrac12\) makes the total zero when the two agree. For \(P = \mathcal{N}(0, 1)\) and \(Q = \mathcal{N}(0, 4)\) the formula gives \(D_{\textrm{KL}}(P\|Q) = \log 2 + \tfrac18 - \tfrac12 \approx 0.318\) nats but \(D_{\textrm{KL}}(Q\|P) = -\log 2 + 2 - \tfrac12 \approx 0.807\) nats, so KL is not symmetric.
The triangle inequality fails for a different reason. For unit-variance Gaussians centered at \(0\), \(1\) and \(2\) the formula gives \(D_{\textrm{KL}} = \tfrac{1}{2}\) for each adjacent pair but \(2\) for the outer pair, and \(2 > \tfrac{1}{2} + \tfrac{1}{2}\) in either argument order. KL grows like the square of the distance between the means, and squared distances do not satisfy the triangle inequality.
The asymmetry has a use: the direction of KL is a modeling decision that changes what a fitted model does (Section 28.3.2.4). Some divergences are metrics, among them the total variation distance, the Hellinger distance \(d_{\mathrm{H}}\) and the Wasserstein distance \(W_1\). When an argument needs the triangle inequality, as coupling arguments and convergence proofs do, those are the ones to use.
28.3.2 f-Divergences
KL compares \(P\) and \(Q\) through the ratio \(p/q\). This part keeps the ratio and changes the function applied to it. The result is a family with one proof of non-negativity, one common behavior when \(P\) is close to \(Q\), and one variational form that can be estimated from samples.
28.3.2.1 The f-Divergence Template
Gibbs’ inequality, \(D_{\textrm{KL}}(P\|Q) \geq 0\), is the reason KL is a divergence. Which properties of KL did its proof use, and what else has them? We answer in three steps.
First, we write KL as an average under \(Q\) of a function of the ratio \(u(x) = p(x)/q(x)\):
\[ D_{\textrm{KL}}(P\|Q) = \sum_x p(x) \log\frac{p(x)}{q(x)} = \sum_x q(x)\, \frac{p(x)}{q(x)} \log\frac{p(x)}{q(x)} = \mathbb{E}_{x \sim Q}\big[u(x) \log u(x)\big]. \]
Thus KL weighs each outcome by \(Q\) and charges it \(u \log u\). On the running pair of Section 28.1, \(P = (0.6, 0.3, 0.1)\) and \(Q = (0.2, 0.5, 0.3)\), the ratios are \(u = 3\), \(0.6\) and \(\tfrac13\), with weights \(0.2\), \(0.5\) and \(0.3\):
\[ 0.2\,(3 \log 3) + 0.5\,(0.6 \log 0.6) + 0.3\,\big(\tfrac13 \log \tfrac13\big) = 0.659 - 0.153 - 0.110 = 0.396 \textrm{ nats}, \]
the KL divergence computed in that section.
Second, Gibbs’ proof used only two facts about \(u \log u\): it is convex, and it is zero at \(u = 1\). Third, we replace \(u \log u\) by any function with these two properties. Let \(f : (0, \infty) \to \mathbb{R}\) be convex with \(f(1) = 0\), and let \(p(x) = 0\) wherever \(q(x) = 0\) (we write \(P \ll Q\)). The f-divergence with generator \(f\) is (Csiszár 1967)
\[ D_f(P\|Q) = \mathbb{E}_{x \sim Q}\!\left[ f\!\left( \frac{p(x)}{q(x)} \right) \right]. \tag{28.3.2}\]
The ratio \(u = p/q\) says, point by point, how much \(P\) over- or under-represents \(x\) relative to \(Q\). The generator \(f\) decides how to penalize that discrepancy, with no penalty at \(u = 1\), and the expectation under \(Q\) adds up the penalties.
We call \(f\) strictly convex at \(1\) if some line through \((1, 0)\) lies strictly below \(f\) away from \(1\): \(f(u) > c\,(u - 1)\) for all \(u \neq 1\) and some slope \(c\).
Proposition (non-negativity). For any convex \(f\) with \(f(1) = 0\) and \(P \ll Q\),
\[ D_f(P\|Q) \geq 0, \]
and if \(f\) is strictly convex at \(1\), then \(D_f(P\|Q) = 0\) if and only if \(P = Q\).
Proof. Jensen’s inequality (Section 26.2.2.7) says that \(\mathbb{E}[f(U)] \geq f(\mathbb{E}[U])\) for a convex \(f\) and a random variable \(U\). Apply it to \(U = u(x)\) with \(x \sim Q\). The step that makes the argument work is that the ratio averages to one under \(Q\), \(\mathbb{E}_Q[u] = \sum_x q(x)\, p(x)/q(x) = \sum_x p(x) = 1\). Hence
\[ D_f(P\|Q) = \mathbb{E}_Q[f(u)] \geq f(\mathbb{E}_Q[u]) = f(1) = 0. \]
For the equality case, take the line \(c\,(u-1)\) below \(f\). Then \(D_f(P\|Q) \geq \mathbb{E}_Q[c\,(u - 1)] = 0\), and the gap is the average of \(f(u) - c\,(u - 1)\), which is positive wherever \(u \neq 1\). So \(D_f = 0\) forces \(u = 1\) for \(Q\)-almost every \(x\), that is, \(P = Q\). \(\blacksquare\)
This is Gibbs’ inequality run for every generator at once: with \(f(u) = u \log u\) the proof is the one of Section 28.1.
The definition assumed \(P \ll Q\), and the opening’s point masses violate it. Three conventions extend \(D_f\) to every pair of distributions on the sample space \(\mathcal{X}\). They matter because generative models begin training in this regime, with the model’s samples and the data in disjoint regions. Outcomes with \(p(x) = q(x) = 0\) contribute nothing (\(0 \cdot f(0/0) = 0\)). Where \(p(x) = 0 < q(x)\), the term is \(q(x)\, f(0)\) with \(f(0) := \lim_{u \downarrow 0} f(u)\), possibly \(+\infty\), as for reverse KL. Where \(q(x) = 0 < p(x)\), the term is \(p(x)\, f'(\infty)\) with \(f'(\infty) := \lim_{t \to \infty} f(t)/t\), possibly \(+\infty\), as for KL. For general measures the same rule reads: the part \(P_\perp\) of \(P\) that sits where \(Q\) has no mass contributes \(f'(\infty)\, P_\perp(\mathcal{X})\).
On the point masses \(\delta_0\) and \(\delta_d\) with \(d \neq 0\), the outcome \(0\) has \(q = 0 < p = 1\) and the outcome \(d\) has \(p = 0 < q = 1\), so
\[ D_f(\delta_0 \| \delta_d) = f(0) + f'(\infty) \qquad \textrm{for every } d \neq 0. \]
For total variation, defined below with \(f(u) = \tfrac12|u - 1|\), this is \(\tfrac12 + \tfrac12 = 1\); for Jensen–Shannon it is \(\tfrac12 \log 2 + \tfrac12 \log 2 = \log 2\); for squared Hellinger, \(1 + 1 = 2\); for \(\chi^2\) and KL, \(f'(\infty) = \infty\). Every f-divergence is thus a constant on disjoint supports. It carries no information about how far apart the supports are, which explains the first three rows of Table 28.3.1.
28.3.2.2 Common Generators
Each row of Table 28.3.2 is one choice of \(f\), and Figure 28.3.1 plots the curves. The column \(f''(1)\), the curvature at \(u = 1\), matters in the next subsection.
| Divergence | Generator \(f(u)\) | \(f''(1)\) | Symmetric? | Metric? |
|---|---|---|---|---|
| Kullback–Leibler (forward) | \(u \log u\) | \(1\) | no | no |
| reverse KL | \(-\log u\) | \(1\) | no | no |
| Pearson \(\chi^2\) | \((u - 1)^2\) | \(2\) | no | no |
| squared Hellinger \(d_{\mathrm{H}}^2\) | \((\sqrt{u} - 1)^2\) | \(\tfrac12\) | yes | \(d_{\mathrm{H}}\) is a metric |
| total variation | \(\tfrac{1}{2}\lvert u - 1 \rvert\) | none (corner) | yes | yes |
| Jensen–Shannon | \(\tfrac{u}{2} \log u - \tfrac{u+1}{2} \log \tfrac{u+1}{2}\) | \(\tfrac14\) | yes | \(\sqrt{\textrm{JS}}\) is a metric |
| \(\alpha\)-divergence (\(\alpha \neq 0, 1\)) | \(\dfrac{u^\alpha-\alpha u+\alpha-1}{\alpha(\alpha-1)}\) | \(1\) | only at \(\alpha = \tfrac{1}{2}\) | square root at \(\alpha = \tfrac{1}{2}\) |

Reverse KL uses the generator \(f(u) = -\log u\), and \(\mathbb{E}_Q[-\log(p/q)] = \mathbb{E}_Q[\log(q/p)] = D_{\textrm{KL}}(Q\|P)\). So the asymmetry of KL is a choice of generator: the two directions are two rows of the table (problem 1a gives the general rule for swapping arguments).
Total variation uses \(f(u) = \tfrac{1}{2}|u - 1|\), which unwinds to \(\sum_x q(x)\, \tfrac12 |p(x)/q(x) - 1| = \tfrac{1}{2}\sum_x |p(x) - q(x)|\), half the \(\ell_1\) distance between the probability vectors. On the running pair, \(\textrm{TV} = \tfrac12(0.4 + 0.2 + 0.2) = 0.4\). Pearson’s divergence unwinds the same way, to \(\chi^2(P\|Q) = \sum_x (p(x) - q(x))^2 / q(x)\), which here is \(0.16/0.2 + 0.04/0.5 + 0.04/0.3 = 1.0133\).
The Jensen–Shannon divergence (Lin 1991) symmetrizes KL through the even mixture \(M = \tfrac{1}{2}(P + Q)\):
\[ \textrm{JS}(P, Q) = \frac{1}{2} D_{\textrm{KL}}(P \,\|\, M) + \frac{1}{2} D_{\textrm{KL}}(Q \,\|\, M). \tag{28.3.3}\]
Each distribution is compared with the mixture, which has mass wherever either one does, so neither KL term can be infinite. Thus JS is symmetric and bounded, \(0 \leq \textrm{JS}(P, Q) \leq \log 2\), with the upper bound attained exactly when \(P\) and \(Q\) have disjoint supports (then \(p/m = 2\) wherever \(p > 0\)). Its square root is a metric (Endres and Schindelin 2003). Expanding Equation 28.3.3 in the ratio \(u\) gives the generator in the table (problem 1c).
The squared Hellinger divergence unwinds to \(d_{\mathrm{H}}^2(P, Q) = \sum_x \big(\sqrt{p(x)} - \sqrt{q(x)}\big)^2\). So \(d_{\mathrm{H}}\) is the Euclidean distance between the vectors \(\sqrt{p}\) and \(\sqrt{q}\), which is why it is a metric (problem 5b).
We evaluate every generator on the running pair, in both argument orders, and check the JS generator against the mixture formula.
def f_divergence(f, p, q):
    """D_f(P||Q) = sum_x q(x) f(p(x)/q(x)); nats for KL/JS, else unitless."""
    return np.sum(q * f(p / q))

generators = {
    'KL':          lambda u: u * np.log(u),
    'reverse KL':  lambda u: -np.log(u),
    'chi^2':       lambda u: (u - 1) ** 2,
    'Hellinger^2': lambda u: (np.sqrt(u) - 1) ** 2,
    'TV':          lambda u: 0.5 * np.abs(u - 1),
    'JS':          lambda u: u / 2 * np.log(u) - (u + 1) / 2 * np.log((u + 1) / 2),
}

p = np.array([0.6, 0.3, 0.1])
q = np.array([0.2, 0.5, 0.3])
for name, f in generators.items():
    print(f'{name:12s} D_f(P||Q) = {f_divergence(f, p, q):.4f}   '
          f'D_f(Q||P) = {f_divergence(f, q, p):.4f}')

m = (p + q) / 2
js_mix = 0.5 * f_divergence(generators['KL'], p, m) \
    + 0.5 * f_divergence(generators['KL'], q, m)
print(f'JS via the mixture formula: {js_mix:.4f}')
KL D_f(P||Q) = 0.3961 D_f(Q||P) = 0.3653
reverse KL D_f(P||Q) = 0.3653 D_f(Q||P) = 0.3961
chi^2 D_f(P||Q) = 1.0133 D_f(Q||P) = 0.8000
Hellinger^2 D_f(P||Q) = 0.1862 D_f(Q||P) = 0.1862
TV D_f(P||Q) = 0.4000 D_f(Q||P) = 0.4000
JS D_f(P||Q) = 0.0911 D_f(Q||P) = 0.0911
JS via the mixture formula: 0.0911The KL row is asymmetric (\(0.3961\) against \(0.3653\) nats, the two numbers of Section 28.1), and the reverse-KL row is the KL row with its columns swapped, as the generator algebra predicts. The \(\chi^2\) row is also asymmetric (\(1.0133\) against \(0.8000\)). Squared Hellinger (\(0.1862\)), TV (\(0.4\)) and JS are symmetric. JS, at \(0.0911\) nats, sits well under its ceiling of \(\log 2 \approx 0.693\), and the mixture formula Equation 28.3.3 gives the same value.
The table’s last row is a family within the family (Amari 2016). For each \(\alpha \neq 0, 1\) it uses the generator
\[ f_\alpha(u)=\frac{u^\alpha-\alpha u+\alpha-1}{\alpha(\alpha-1)}, \tag{28.3.4}\]
which is convex with \(f_\alpha(1) = 0\). As \(\alpha \to 1\) it tends to \(u\log u - u + 1\) and as \(\alpha \to 0\) to \(-\log u + u - 1\). A multiple of \(u - 1\) averages to zero under \(Q\), so these limits define forward and reverse KL, and the knob \(\alpha\) moves between the two directions. At \(\alpha = \tfrac12\) the generator is \(2(\sqrt{u} - 1)^2\), twice the squared Hellinger generator.
28.3.2.3 The Local Quadratic
The generators in Figure 28.3.1 differ greatly away from \(u = 1\). Do they still differ when \(P\) is close to \(Q\)?
Adding \(c\,(u - 1)\) to a generator changes no divergence, because \(\mathbb{E}_Q[c\,(u - 1)] = c\,(1 - 1) = 0\) (problem 1b). So the value \(f(1) = 0\) and the slope \(f'(1)\) carry no information, and the first property that distinguishes generators is the curvature \(f''(1)\). Near \(u = 1\) every smooth generator looks like the parabola \(\tfrac12 f''(1)(u - 1)^2\), and the average of \((u-1)^2\) under \(Q\) is the \(\chi^2\) divergence, \(\mathbb{E}_Q[(u - 1)^2] = \sum_x (p(x) - q(x))^2/q(x)\). Let \(\delta = \max_x |u(x) - 1|\) measure how far the ratio strays from \(1\).
Proposition (local quadratic). Let \(P \ll Q\), let \(0 < \delta < 1\), let \(f\) be three times differentiable on \([1 - \delta, 1 + \delta]\) with \(|f'''| \leq B\) there, and let \(|u(x) - 1| \leq \delta\) for every \(x\) with \(q(x) > 0\). Then
\[ \left| D_f(P\|Q) - \frac{f''(1)}{2}\, \chi^2(P\|Q) \right| \leq \frac{B \delta}{6}\, \chi^2(P\|Q). \tag{28.3.5}\]
Proof. Taylor’s theorem with remainder gives \(f(u) = f'(1)(u - 1) + \tfrac12 f''(1)(u - 1)^2 + R(u)\) with \(|R(u)| \leq B |u - 1|^3 / 6\), since \(f(1) = 0\). Take \(\mathbb{E}_Q\) term by term. The linear term vanishes because \(\mathbb{E}_Q[u - 1] = 0\); this is the step that makes all generators agree. The quadratic term is \(\tfrac12 f''(1)\, \chi^2(P\|Q)\). The remainder obeys \(\mathbb{E}_Q|R| \leq \tfrac{B}{6}\,\mathbb{E}_Q|u - 1|^3 \leq \tfrac{B\delta}{6}\, \mathbb{E}_Q(u - 1)^2 = \tfrac{B\delta}{6}\,\chi^2\). \(\blacksquare\)
Thus \(D_f \approx \tfrac12 f''(1)\, \chi^2\), with a relative error that shrinks in proportion to \(\delta\). To see how close \(P\) must be to \(Q\), we move the running pair’s \(P\) toward \(Q\) along the segment \(P_t = Q + t\,(P - Q)\), which multiplies every \(u - 1\) by \(t\), and print \(D_f(P_t\|Q) / \big(\tfrac12 f''(1)\, \chi^2(P_t\|Q)\big)\) for four generators.
curvature = {'KL': 1.0, 'reverse KL': 1.0, 'Hellinger^2': 0.5, 'JS': 0.25}
for t in (0.5, 0.1, 0.01):
    p_t = q + t * (p - q)                     # moves P_t toward Q as t -> 0
    chi2 = f_divergence(generators['chi^2'], p_t, q)
    ratios = [f_divergence(generators[name], p_t, q) / (c / 2 * chi2)
              for name, c in curvature.items()]
    print(f't = {t:4}: ' + '  '.join(f'{name} {r:.3f}'
                                     for name, r in zip(curvature, ratios)))
t = 0.5: KL 0.844 reverse KL 0.747 Hellinger^2 0.789 JS 0.783
t = 0.1: KL 0.956 reverse KL 0.917 Hellinger^2 0.936 JS 0.935
t = 0.01: KL 0.995 reverse KL 0.990 Hellinger^2 0.993 JS 0.993At \(t = 0.5\) the four divergences are about \(75\%\) to \(85\%\) of their quadratics, at \(t = 0.1\) more than \(91\%\), and at \(t = 0.01\) more than \(99\%\). Once \(t\) is small, the shortfall shrinks in proportion to \(t\), as the proposition’s factor \(\delta\) predicts. Near equality, all smooth f-divergences are the same quadratic up to the constant \(f''(1)\). They disagree only about distant distributions, which is the regime early in training, when the model is far from the data.
The same expansion connects the family to the Fisher information \(\mathbf{I}(\boldsymbol{\theta}) = \mathbb{E}\big[\nabla_{\boldsymbol{\theta}} \log q_{\boldsymbol{\theta}}\, \nabla_{\boldsymbol{\theta}} \log q_{\boldsymbol{\theta}}^\top\big]\) of Section 27.5. For a parametric family, \(\chi^2(q_{\boldsymbol{\theta}}\| q_{\boldsymbol{\theta} + \mathbf{h}}) \approx \mathbf{h}^\top \mathbf{I}(\boldsymbol{\theta})\, \mathbf{h}\) for small \(\mathbf{h}\), so every smooth \(D_f\) has Hessian \(f''(1)\, \mathbf{I}(\boldsymbol{\theta})\) at \(\mathbf{h} = \mathbf{0}\) (Amari 1998). Total variation is the exception: its generator has a corner at \(u = 1\) and no curvature, and problem 2b shows what that changes when \(P\) approaches \(Q\).
28.3.2.4 Forward and Reverse KL
The two KL rows of the table are two different fitting criteria. When we fit a model \(Q_\theta\) to a target \(P\), the two directions ask for different things:
- Forward KL, \(D_{\textrm{KL}}(P \,\|\, Q_\theta) = \mathbb{E}_P[\log(p/q_\theta)]\), averages over the truth. Wherever \(P\) puts mass, \(q_\theta\) appears in a denominator: if \(q_\theta(x) \to 0\) while \(p(x) > 0\), the divergence blows up. Forward KL is zero-avoiding: the model must cover every mode of the data, even if that smears mass over regions \(P\) never visits.
- Reverse KL, \(D_{\textrm{KL}}(Q_\theta \,\|\, P) = \mathbb{E}_{Q_\theta}[\log(q_\theta/p)]\), averages over the model. Now \(p\) is the denominator: the model is punished for putting mass where the truth has none, while modes it never visits leave the objective untouched. Reverse KL is zero-forcing: the model concentrates on the mass it can explain and assigns little probability to the rest.
The two directions correspond to two fitting paradigms. Maximum likelihood is forward KL minimization: Section 27.5.2.1 shows that the average negative log-likelihood is the cross-entropy from the empirical distribution to the model, which differs from forward KL by a constant. Variational inference and the ELBO (Section 27.5.5) minimize the reverse KL from the approximate posterior to the true one, which is why variational posteriors tend to be too narrow.
When the model family contains the target, both directions agree on the answer. They differ for a misspecified family, and the simplest instance is fitting a single Gaussian to a bimodal target. For the forward direction the optimum has a closed form.
Proposition (forward KL fits moments). Let \(P\) have a density with finite differential entropy \(h(P)\) and \(0 < \textrm{Var}_P(X) < \infty\). Over the Gaussian family \(Q = \mathcal{N}(\mu, \sigma^2)\), the forward divergence \(D_{\textrm{KL}}(P \,\|\, Q)\) is minimized at
\[ \mu^* = \mathbb{E}_P[X], \qquad (\sigma^*)^2 = \textrm{Var}_P(X). \]
Proof. Since \(D_{\textrm{KL}}(P\|Q) = -h(P) - \mathbb{E}_P[\log q(X)]\) and \(h(P)\) does not depend on \(Q\), we maximize \(\mathbb{E}_P[\log q(X)] = -\tfrac{1}{2}\log(2\pi\sigma^2) - \mathbb{E}_P[(X-\mu)^2]/(2\sigma^2)\). For any \(\sigma\), \(\mathbb{E}_P[(X-\mu)^2] = \textrm{Var}_P(X) + (\mathbb{E}_P[X] - \mu)^2\) is smallest at \(\mu = \mathbb{E}_P[X]\). With \(v = \textrm{Var}_P(X)\) it remains to maximize \(\psi(\sigma^2) = -\tfrac{1}{2}\log\sigma^2 - v/(2\sigma^2)\), whose derivative \(\psi'(\sigma^2) = (v - \sigma^2)/(2\sigma^4)\) is positive for \(\sigma^2 < v\) and negative for \(\sigma^2 > v\). So \(\sigma^2 = v\) is the maximum. \(\blacksquare\)
The same argument works for any exponential family: the forward-KL fit matches the expected sufficient statistics, the M-projection of information geometry (Amari 2016). The reverse direction has no such closed form, and it can have one local optimum per mode. The following cell computes both fits for the mixture \(P = 0.7\,\mathcal{N}(-2, 0.6^2) + 0.3\,\mathcal{N}(2, 0.6^2)\). It evaluates each KL by quadrature on a grid and minimizes over \((\mu, \log\sigma)\) with a derivative-free optimizer.
w, mus, sigmas = np.array([0.7, 0.3]), np.array([-2.0, 2.0]), np.array([0.6, 0.6])
x = np.linspace(-8.0, 8.0, 4001)

def log_components(x, w, mus, sigmas):
    """log(w_k N(x; mu_k, sigma_k^2)) for every component k; shape (k, len(x))."""
    return (np.log(w)[:, None] - 0.5 * np.log(2 * np.pi * sigmas[:, None] ** 2)
            - (x - mus[:, None]) ** 2 / (2 * sigmas[:, None] ** 2))

def log_mix(x, w, mus, sigmas):
    """Log-density of the mixture sum_k w_k N(mu_k, sigma_k^2), computed stably."""
    c = log_components(x, w, mus, sigmas)
    c_max = c.max(axis=0)
    return c_max + np.log(np.exp(c - c_max).sum(axis=0))

log_p = lambda x: log_mix(x, w, mus, sigmas)

def log_q(x, theta):
    mu, log_sigma = theta
    return (-0.5 * np.log(2 * np.pi) - log_sigma
            - (x - mu) ** 2 / (2 * np.exp(2 * log_sigma)))

def kl(log_a, log_b, x):
    """D_KL(A||B) by quadrature on the grid x; in nats."""
    return integrate.trapezoid(np.exp(log_a) * (log_a - log_b), x)

fwd = lambda th: kl(log_p(x), log_q(x, th), x)     # D_KL(P || Q_theta)
rev = lambda th: kl(log_q(x, th), log_p(x), x)     # D_KL(Q_theta || P)

th_fwd = optimize.minimize(fwd, x0=[0.0, 0.0], method='Nelder-Mead').x
th_rev = optimize.minimize(rev, x0=[0.0, 0.0], method='Nelder-Mead').x
th_rev2 = optimize.minimize(rev, x0=[2.5, -0.5], method='Nelder-Mead').x

for name, th, val in [('forward KL', th_fwd, fwd(th_fwd)),
                      ('reverse KL', th_rev, rev(th_rev)),
                      ('reverse KL, 2nd start', th_rev2, rev(th_rev2))]:
    print(f'{name:22s} mu = {th[0]:+.3f}, sigma = {np.exp(th[1]):.3f}, '
          f'KL = {val:.3f} nats')

d2l.plot(x, [np.exp(log_p(x)), np.exp(log_q(x, th_fwd)),
             np.exp(log_q(x, th_rev))], 'x', 'density',
         legend=['target P (mixture)', 'forward-KL fit', 'reverse-KL fit'],
figsize=(6, 3))forward KL mu = -0.800, sigma = 1.929, KL = 0.558 nats
reverse KL mu = -1.998, sigma = 0.603, KL = 0.356 nats
reverse KL, 2nd start mu = +1.995, sigma = 0.607, KL = 1.202 nats
forward KL             mu = -0.800, sigma = 1.929, KL = 0.558 nats
reverse KL             mu = -1.998, sigma = 0.603, KL = 0.356 nats
reverse KL, 2nd start  mu = +1.995, sigma = 0.607, KL = 1.202 nats
forward KL             mu = -0.800, sigma = 1.929, KL = 0.558 nats
reverse KL             mu = -1.998, sigma = 0.603, KL = 0.356 nats
reverse KL, 2nd start  mu = +1.995, sigma = 0.607, KL = 1.202 nats
forward KL             mu = -0.800, sigma = 1.929, KL = 0.558 nats
reverse KL             mu = -1.998, sigma = 0.603, KL = 0.356 nats
reverse KL, 2nd start  mu = +1.995, sigma = 0.607, KL = 1.202 nats
The two objectives choose different Gaussians for the same target. The forward fit lands at \(\mu = -0.800\), \(\sigma = 1.929\): the mixture’s mean \(0.7(-2) + 0.3(2) = -0.8\) and standard deviation \(\sqrt{3.72} \approx 1.929\), as the proposition says. It is a broad Gaussian draped across both modes, with substantial mass in the valley between them where \(P\) has almost none. The reverse fit lands at \(\mu = -1.998\), \(\sigma = 0.603\): it matches the dominant component and assigns little mass to the minor one. Its divergence, \(0.356\) nats, is close to \(\log(1/0.7) \approx 0.357\), the divergence of treating the \(70\%\) component as the whole distribution. Reverse KL also has more than one local optimum: started near the minor mode, the optimizer converges to \(\mu = +1.995\) with KL \(1.202 \approx \log(1/0.3)\) nats. Which optimum a variational method finds depends on its initialization.
Maximum likelihood penalizes a missed mode heavily, and reverse-KL objectives do not. The two generators of the table, \(u \log u\) and \(-\log u\), encode this asymmetry.
28.3.2.5 The Fenchel Conjugate and the f-GAN Bound
A generator network can sample from its distribution \(Q\), and we hold samples from the data distribution \(P\), but neither source tells us the ratio \(p(x)/q(x)\) that Equation 28.3.2 needs. Can \(D_f\) be computed from samples alone?
The tool is the convex conjugate of Section 26.6.2: for a convex \(f\),
\[ f^*(t) = \sup_{u}\, \big( ut - f(u) \big), \]
and for closed convex \(f\) the biconjugation theorem gives back \(f(u) = \sup_t \big( ut - f^*(t) \big)\). Geometrically, \(-f^*(t)\) is the intercept of the tangent line to \(f\) with slope \(t\), and biconjugation says that a convex function is the upper envelope of its tangent lines (Figure 28.3.2). Keeping one tangent instead of the envelope gives the Fenchel–Young inequality
\[ f(u) \geq ut - f^*(t) \quad \textrm{for all } t, \tag{28.3.6}\]
with equality when \(t\) is the slope of \(f\) at \(u\), that is, \(t = f'(u)\). Thus every tangent line lies below the curve and touches it where the slopes match.

Now we apply the inequality pointwise inside the divergence and let the slope vary with \(x\). We choose a function \(T(x)\), the critic, and apply Equation 28.3.6 at \(u = p(x)/q(x)\) and \(t = T(x)\).
Proposition (f-GAN variational bound). Let \(f\) be convex and differentiable with \(f(1) = 0\), let \(P \ll Q\), and let \(T\) be any critic with \(\mathbb{E}_P|T| < \infty\) and \(\mathbb{E}_Q|f^*(T)| < \infty\). Then
\[ D_f(P\|Q) \;\geq\; \mathbb{E}_{x \sim P}[T(x)] - \mathbb{E}_{x \sim Q}[f^*(T(x))]. \tag{28.3.7}\]
The supremum of the right side over critics equals \(D_f(P\|Q)\), and it is attained by \(T^\star(x) = f'\big(p(x)/q(x)\big)\) wherever \(T^\star\) is finite (Nowozin et al. 2016).
Proof. Multiply Equation 28.3.6 at \(u = p(x)/q(x)\), \(t = T(x)\) by \(q(x) \geq 0\):
\[ q(x)\, f\!\left(\frac{p(x)}{q(x)}\right) \;\geq\; p(x)\, T(x) - q(x)\, f^*(T(x)). \]
Summing (or integrating) over \(x\) gives Equation 28.3.7. Since Fenchel–Young holds with equality at \(t = f'(u)\), the choice \(T^\star(x) = f'(p(x)/q(x))\) makes the inequality an equality at every \(x\), hence in expectation. \(\blacksquare\)
Both expectations on the right of Equation 28.3.7 are averages over samples, of \(T\) under \(P\) and of \(f^*(T)\) under \(Q\), and neither needs a density. A neural network \(T\) makes the bound estimable and optimizable from minibatches. In the f-GAN objective the critic maximizes the bound, which equals the divergence at the optimal critic, while the generator that controls \(Q\) minimizes it. For the KL generator \(f(u) = u \log u\) the conjugate is \(f^*(t) = e^{t-1}\), so \(D_{\textrm{KL}}(P\|Q) \geq \mathbb{E}_P[T] - \mathbb{E}_Q[e^{T - 1}]\) for every critic.
The original GAN of Goodfellow et al. (2014) is the case \(f(u) = u\log u - (u+1)\log(u+1)\), which equals \(2 f_{\textrm{JS}}(u) - \log 4 - (u - 1)\log 2\): twice the Jensen–Shannon generator, up to a multiple of \(u - 1\) and a constant. Its critic is the log of a discriminator, \(T = \log D\), and at the optimal discriminator \(D^\star = p/(p + q)\) the value of the game is \(2\,\textrm{JS}(P, Q) - \log 4\). On the running pair this is \(2(0.0911) - 1.386 = -1.204\).
Two caveats limit the bound in practice. First, the bound is tight only at the optimal critic, so a critic that is not fully trained underestimates the divergence: adversarial estimates are biased low. Second, on disjoint supports the ratio is \(0\) or \(\infty\), so \(T^\star\) is constant on each support (it equals \(f'(0)\) on one and \(f'(\infty)\) on the other). An optimal critic that is constant on the model’s support supplies no gradient to the generator, which is the problem that the transport part of this section removes.
We can measure the first caveat on the running pair, where expectations are sums. Take the \(\chi^2\) generator \(f(u) = (u-1)^2\). Its conjugate over all of \(\mathbb{R}\) is \(f^*(t) = t + t^2/4\) and its optimal critic is \(T^\star = 2(p/q - 1)\), as problem 3a derives. The conjugate taken over \(u > 0\) alone is smaller, so using the conjugate over \(\mathbb{R}\) only loosens the bound, which stays exact at \(T^\star\). Consider the critics \(T = c\,T^\star\) for a scale \(c\), from untrained (\(c = 0\)) to overconfident (\(c = 2\)). Three sums give the bound in closed form: \(\sum_x p\, T^\star = 2\chi^2\), \(\sum_x q\, T^\star = 0\) and \(\sum_x q\, (T^\star)^2/4 = \chi^2\), so
\[ \mathbb{E}_P[c\,T^\star] - \mathbb{E}_Q[f^*(c\,T^\star)] = 2c\,\chi^2 - c^2 \chi^2 = \chi^2(P\|Q)\,(2c - c^2). \]
The bound is a concave parabola in \(c\) with its maximum \(\chi^2\) at \(c = 1\). The following cell checks this on the running pair.
chi_sq = generators['chi^2']            # f(u) = (u - 1)^2
f_star = lambda t: t + t ** 2 / 4       # its convex conjugate

def fgan_bound(T, p, q):
    """E_P[T] - E_Q[f*(T)]: a lower bound on D_f for any critic T."""
    return np.sum(p * T) - np.sum(q * f_star(T))

T_star = 2 * (p / q - 1)                # the optimal critic f'(p/q)
scales = np.array([0.0, 0.25, 0.5, 1.0, 1.5, 2.0])
print(f'exact chi^2(P||Q) = {f_divergence(chi_sq, p, q):.4f}')
print('c     ' + ''.join(f'{c:8.2f}' for c in scales))
print('bound ' + ''.join(f'{fgan_bound(c * T_star, p, q):8.4f}' for c in scales))
cs = np.linspace(0, 2, 41)
d2l.plot(cs, [[fgan_bound(c * T_star, p, q) for c in cs],
              np.full_like(cs, f_divergence(chi_sq, p, q))],
         'critic scale c', 'value', legend=['bound at c T*', 'chi^2(P||Q)'],
figsize=(4.5, 2.8))exact chi^2(P||Q) = 1.0133
c 0.00 0.25 0.50 1.00 1.50 2.00
bound 0.0000 0.4433 0.7600 1.0133 0.7600 0.0000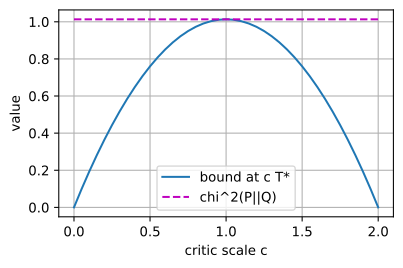
exact chi^2(P||Q) = 1.0133
c         0.00    0.25    0.50    1.00    1.50    2.00
bound   0.0000  0.4433  0.7600  1.0133  0.7600  0.0000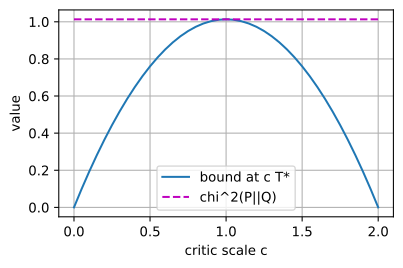
exact chi^2(P||Q) = 1.0133
c         0.00    0.25    0.50    1.00    1.50    2.00
bound   0.0000  0.4433  0.7600  1.0133  0.7600  0.0000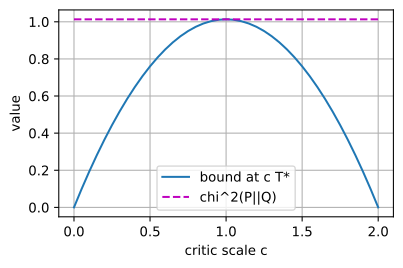
exact chi^2(P||Q) = 1.0133
c         0.00    0.25    0.50    1.00    1.50    2.00
bound   0.0000  0.4433  0.7600  1.0133  0.7600  0.0000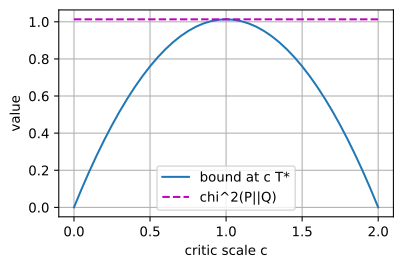
The optimal critic reproduces the exact divergence, \(1.0133\). A half-trained critic (\(c = \tfrac12\)) reports \(0.76\), which is \(75\%\) of the divergence, and an overconfident one (\(c = 2\)) reports zero. Every critic other than \(T^\star\) reports less than the divergence, which is the low bias of the first caveat.
28.3.3 Test Functions and Transport
The f-divergences need the ratio \(p/q\), which samples do not give and which disjoint supports destroy. This part builds comparisons that ask only how differently \(P\) and \(Q\) average functions, and then how far mass has to move.
28.3.3.1 Total Variation and Pinsker’s Inequality
The simplest functions to average are indicators of events, and averaging an indicator gives a probability. So the first question is whether some event has very different probabilities under \(P\) and under \(Q\). The total variation distance is the largest such disagreement over all events \(A\):
\[ \textrm{TV}(P, Q) = \sup_{A} \,\lvert P(A) - Q(A) \rvert. \tag{28.3.8}\]
If \(\textrm{TV}(P, Q) = 0.03\), then no event distinguishes the two distributions by more than three percentage points. TV is a metric (symmetry is visible in Equation 28.3.8, and the triangle inequality is problem 5a), and the supremum has a closed form.
Proposition (TV is half the \(\ell_1\) distance). For discrete \(P\), \(Q\),
\[ \textrm{TV}(P, Q) = \frac{1}{2} \sum_x \lvert p(x) - q(x) \rvert, \]
and the supremum in Equation 28.3.8 is attained at \(A^\star = \{x : p(x) > q(x)\}\).
Proof. For any event \(A\), \(P(A) - Q(A) = \sum_{x \in A} (p(x) - q(x)) \leq \sum_{x \in A^\star} (p(x) - q(x))\): enlarging \(A\) to include every \(x\) with \(p(x) > q(x)\) and discarding the rest only adds non-negative terms and removes non-positive ones. Since \(\sum_x (p(x) - q(x)) = 0\), the positive part equals the negative part in magnitude, so
\[ \sum_{x \in A^\star} (p(x) - q(x)) = \frac{1}{2} \sum_x \lvert p(x) - q(x) \rvert. \]
The same argument bounds \(Q(A) - P(A)\) by the same quantity. \(\blacksquare\)
So the half-\(\ell_1\) form of the generator table and the supremum over events are the same number, \(0.4\) on the running pair. Figure 28.3.3 shows the picture for two densities: the region where \(p > q\) and the region where \(q > p\) have equal area, each equal to TV, and the best event is the region where \(P\) is the better explanation.

This gives TV its operational meaning. Hand a tester one sample, drawn from \(P\) or from \(Q\) with probability \(\tfrac12\) each, and ask which distribution produced it. A test that answers “\(P\)” exactly when the sample lands in an event \(A\) is right with probability
\[ \tfrac12 P(A) + \tfrac12 \big(1 - Q(A)\big) = \tfrac12 \big(1 + P(A) - Q(A)\big) \leq \tfrac12 \big(1 + \textrm{TV}(P, Q)\big), \]
with equality at \(A = A^\star\). Every test is of this form for some \(A\) (a randomized test averages such tests and does no better), so the best possible test beats coin flipping by \(\textrm{TV}/2\). Thus TV bounds what any test can detect. The next inequality says that KL bounds TV: a small KL divergence certifies that no test can tell the distributions apart well.
Proposition (Pinsker’s inequality). (Pinsker 1964) For distributions \(P\) and \(Q\) on a finite or countable set,
\[ \textrm{TV}(P, Q) \;\leq\; \sqrt{ \tfrac{1}{2}\, D_{\textrm{KL}}(P\|Q) }. \tag{28.3.9}\]
Proof. Step 1: two outcomes. For \(a, b \in (0, 1)\) let \(d(a\|b) = a \log\frac{a}{b} + (1-a) \log\frac{1-a}{1-b}\) be the KL divergence between coins with heads-probabilities \(a\) and \(b\); their TV distance is \(|a - b|\), so we must show \(d(a\|b) \geq 2(a-b)^2\). Fix \(b\) and let \(\rho(a) = d(a\|b) - 2(a - b)^2\). Then \(\rho(b) = 0\), \(\rho'(b) = 0\), and
\[ \rho''(a) = \frac{1}{a(1-a)} - 4 \geq 0, \]
since \(a(1-a) \leq \tfrac{1}{4}\). A convex function with value and slope zero at \(a = b\) is non-negative everywhere.
Step 2: reduction to two outcomes. Let \(A^\star = \{p > q\}\), and set \(a = P(A^\star)\), \(b = Q(A^\star)\), so that \(\textrm{TV}(P, Q) = a - b\) by the previous proposition. Merging the outcomes inside \(A^\star\) and inside its complement can only decrease KL, by the log-sum inequality: for non-negative numbers,
\[ \sum_i a_i \log\frac{a_i}{b_i} \geq \big(\sum_i a_i\big) \log \frac{\sum_i a_i}{\sum_i b_i}, \]
itself one application of Jensen to \(t \mapsto t\log t\). Applied separately to the terms in \(A^\star\) and in its complement,
\[ D_{\textrm{KL}}(P\|Q) \;\geq\; d(a\|b) \;\geq\; 2(a - b)^2 = 2\,\textrm{TV}(P, Q)^2, \]
which rearranges to Equation 28.3.9. \(\blacksquare\)
The merging step is a special case of the next proposition, which holds for every f-divergence. A channel \(\kappa(y \mid x)\) is any rule, deterministic or random, that turns an outcome \(x\) into an outcome \(y\); it maps \(P\) to the output distribution \((P\kappa)(y) = \sum_x \kappa(y \mid x)\, p(x)\), and \(Q\) likewise.
Proposition (data processing for f-divergences). For any channel \(\kappa\), convex \(f\) with \(f(1) = 0\), and \(P \ll Q\) on a finite set,
\[ D_f(P\kappa \,\|\, Q\kappa) \;\leq\; D_f(P\|Q). \tag{28.3.10}\]
Proof. Since \(\sum_y \kappa(y \mid x) = 1\), \(D_f(P\|Q) = \sum_y \sum_x \kappa(y \mid x)\, q(x)\, f\big(p(x)/q(x)\big)\). Fix \(y\) with \((Q\kappa)(y) > 0\). The weights \(\kappa(y \mid x)\, q(x) / (Q\kappa)(y)\) sum to one over \(x\), and averaging the ratios \(p(x)/q(x)\) with these weights gives \((P\kappa)(y)/(Q\kappa)(y)\). Jensen’s inequality therefore bounds the inner sum below by \((Q\kappa)(y)\, f\big((P\kappa)(y)/(Q\kappa)(y)\big)\), which is the \(y\)-th term of \(D_f(P\kappa\|Q\kappa)\). An outcome \(y\) with \((Q\kappa)(y) = 0\) has \(\kappa(y \mid x) = 0\) wherever \(q(x) > 0\), hence also \((P\kappa)(y) = 0\), and contributes nothing to either side. Summing over \(y\) finishes the proof. \(\blacksquare\)
Thus processing the data cannot make two distributions easier to tell apart, whatever the generator. Merging outcomes is the deterministic channel \(x \mapsto \mathbf{1}[x \in A^\star]\) used in Pinsker’s proof, and the data-processing inequality for mutual information, in the next section, is the same principle.
Pinsker’s inequality has no useful converse, because small TV does not imply small KL. A model that assigns \(q = 0\) to a rare event has infinite KL at tiny TV. The bound also goes slack for distant pairs, since TV is at most \(1\) while KL is unbounded. Two unit-variance Gaussians \(50\) apart have \(\textrm{TV} \approx 1\) but, by Equation 28.3.1, KL \(= 50^2/2 = 1250\) nats.
The following experiment asks whether the inequality is ever violated and how tight it is. It draws \(10{,}000\) random pairs of distributions on five outcomes. It then compares coins that approach each other, where the two-outcome analysis says the ratio \(\textrm{TV}/\sqrt{\textrm{KL}/2}\) should approach \(1\).
rng = np.random.default_rng()
pr, qr = rng.dirichlet(np.ones(5), 10000), rng.dirichlet(np.ones(5), 10000)
tv = 0.5 * np.abs(pr - qr).sum(axis=1)
kl_pq = np.sum(pr * np.log(pr / qr), axis=1)
print(f'max TV / sqrt(KL/2) over 10,000 random pairs: '
      f'{np.max(tv / np.sqrt(kl_pq / 2)):.4f}')
for delta in (0.1, 0.01, 0.001):
    a, b = np.array([0.5, 0.5]), np.array([0.5 + delta, 0.5 - delta])
    print(f'coins 1/2 vs 1/2 + {delta:5}: TV / sqrt(KL/2) = '
          f'{delta / np.sqrt(kl_div(a, b) / 2):.6f}')
grid = np.linspace(0, 3, 100)
d2l.plot([kl_pq[:2000], grid], [tv[:2000], np.sqrt(grid / 2)], 'KL (nats)',
         'TV', legend=['random pairs', 'sqrt(KL/2)'], fmts=('.', '-'),
xlim=[0, 3], figsize=(4.5, 3))max TV / sqrt(KL/2) over 10,000 random pairs: 0.9894
coins 1/2 vs 1/2 + 0.1: TV / sqrt(KL/2) = 0.989881
coins 1/2 vs 1/2 + 0.01: TV / sqrt(KL/2) = 0.999900
coins 1/2 vs 1/2 + 0.001: TV / sqrt(KL/2) = 0.999999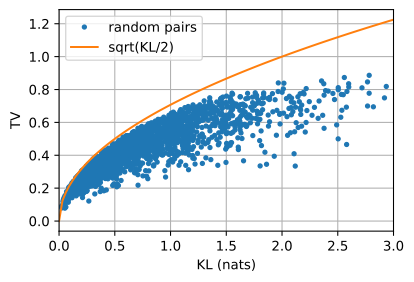
max TV / sqrt(KL/2) over 10,000 random pairs: 0.9861
coins 1/2 vs 1/2 +   0.1: TV / sqrt(KL/2) = 0.989881
coins 1/2 vs 1/2 +  0.01: TV / sqrt(KL/2) = 0.999900
coins 1/2 vs 1/2 + 0.001: TV / sqrt(KL/2) = 0.999999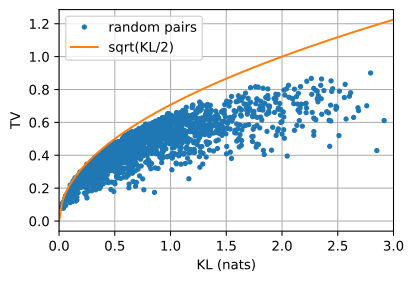
max TV / sqrt(KL/2) over 10,000 random pairs: 0.9857
coins 1/2 vs 1/2 +   0.1: TV / sqrt(KL/2) = 0.989881
coins 1/2 vs 1/2 +  0.01: TV / sqrt(KL/2) = 0.999900
coins 1/2 vs 1/2 + 0.001: TV / sqrt(KL/2) = 0.999999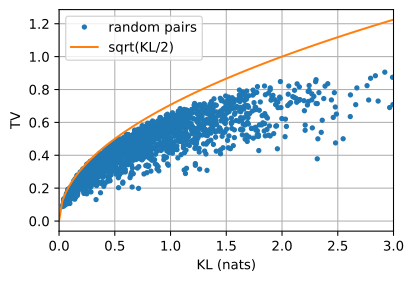
max TV / sqrt(KL/2) over 10,000 random pairs: 0.9900
coins 1/2 vs 1/2 +   0.1: TV / sqrt(KL/2) = 0.989881
coins 1/2 vs 1/2 +  0.01: TV / sqrt(KL/2) = 0.999900
coins 1/2 vs 1/2 + 0.001: TV / sqrt(KL/2) = 0.999999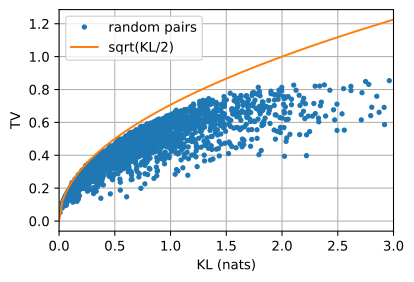
The ratio never exceeds \(1\), and the largest value over \(10{,}000\) random pairs comes within a few hundredths of it. On nearly fair coins it climbs to \(0.9899\), \(0.9999\) and \(0.999999\), so the constant \(\tfrac{1}{2}\) cannot be improved (problem 2c). This sharp constant is due to Csiszár (Csiszár 1967), not to Pinsker’s original argument. The scatter plot shows every pair below the curve \(\sqrt{\textrm{KL}/2}\), with a gap that grows with KL.
28.3.3.2 Integral Probability Metrics and MMD
Total variation takes a supremum over events, that is, over indicator functions. What if we take the supremum over another class of functions, and which classes give a supremum we can compute? For a class \(\mathcal{G}\) of test functions \(g\), the integral probability metric (Müller 1997) is
\[ \textrm{IPM}_{\mathcal{G}}(P, Q) = \sup_{g \in \mathcal{G}} \,\big( \mathbb{E}_{x \sim P}[g(x)] - \mathbb{E}_{x \sim Q}[g(x)] \big). \tag{28.3.11}\]
The class \(\mathcal{G}\) is a panel of auditors, and the IPM reports the largest gap in averages that any auditor in the panel can find. Three panels give three distances in this section. Functions bounded by \(\|g\|_\infty \leq \tfrac{1}{2}\) give total variation, with \(g = \tfrac12\,\textrm{sign}(p - q)\) attaining the supremum. The 1-Lipschitz functions give the Wasserstein distance of the next subsection. The unit ball of a kernel’s feature space gives the maximum mean discrepancy (MMD) (Gretton et al. 2012).
Unlike Equation 28.3.2, which integrates a function of the density ratio, an IPM compares expectations, which samples estimate directly. The class decides whether the supremum can also be computed from samples. For all bounded functions it cannot in general, because a rich enough class separates any two finite samples. The rest of this subsection builds a class for which it can.
We build MMD from the smallest panel up. First, take linear test functions \(g(x) = w\, x\) with \(|w| \leq 1\). Then \(\mathbb{E}_P g - \mathbb{E}_Q g = w\,(\mathbb{E}_P X - \mathbb{E}_Q X)\), and the supremum is \(|\mathbb{E}_P X - \mathbb{E}_Q X|\): the IPM over linear functions is the difference of the means. It cannot see a change of spread; for \(\mathcal{N}(0, 1)\) against \(\mathcal{N}(0, 4)\) it reports \(0\).
Second, take a feature vector \(\boldsymbol{\varphi}(x) = (x, x^2)\) and test functions \(g(x) = \mathbf{w}^\top \boldsymbol{\varphi}(x)\) with \(\|\mathbf{w}\| \leq 1\). Write \(\mathbf{m}_P = \mathbb{E}_P[\boldsymbol{\varphi}(x)]\) for the mean feature of \(P\). Then \(\mathbb{E}_P g - \mathbb{E}_Q g = \mathbf{w}^\top(\mathbf{m}_P - \mathbf{m}_Q)\), and by the Cauchy–Schwarz inequality the supremum of a linear function over the unit ball is the norm of its coefficient vector:
\[ \textrm{MMD}(P, Q) = \sup_{\|\mathbf{w}\| \leq 1} \mathbf{w}^\top(\mathbf{m}_P - \mathbf{m}_Q) = \|\mathbf{m}_P - \mathbf{m}_Q\|. \tag{28.3.12}\]
Thus MMD is the distance between the mean features. For \(\mathcal{N}(0, 1)\) against \(\mathcal{N}(0, 4)\) the mean features are \((0, 1)\) and \((0, 4)\), so \(\textrm{MMD}^2 = 0^2 + 3^2 = 9\): means and second moments are now both compared.
Third, we expand the squared norm. With \(x, x'\) independent draws from \(P\) and \(y, y'\) from \(Q\), \(\|\mathbf{m}_P - \mathbf{m}_Q\|^2 = \mathbb{E}\langle\boldsymbol{\varphi}(x), \boldsymbol{\varphi}(x')\rangle + \mathbb{E}\langle\boldsymbol{\varphi}(y), \boldsymbol{\varphi}(y')\rangle - 2\,\mathbb{E}\langle\boldsymbol{\varphi}(x), \boldsymbol{\varphi}(y)\rangle\). Only inner products of features appear. We call \(k(x, x') = \langle \boldsymbol{\varphi}(x), \boldsymbol{\varphi}(x')\rangle\) the kernel and obtain
\[ \textrm{MMD}^2(P, Q) = \mathbb{E}_{x, x' \sim P}[k(x, x')] + \mathbb{E}_{y, y' \sim Q}[k(y, y')] - 2\, \mathbb{E}_{x \sim P, y \sim Q}[k(x, y)]. \tag{28.3.13}\]
The first two terms measure similarity within each sample and the third similarity across the two. If the samples interleave, the three terms cancel; if they form separate clumps, the within-sample terms exceed the across-sample term.
Fourth, we choose the kernel directly instead of the features. The RBF kernel \(k(x, x') = e^{-(x - x')^2/(2\ell^2)}\) with length scale \(\ell\) factors as \(e^{-x^2/(2\ell^2)}\, e^{-x'^2/(2\ell^2)}\, e^{x x'/\ell^2}\), and the power series of the last factor writes it as an inner product of infinitely many features \(\varphi_n(x) = x^n e^{-x^2/(2\ell^2)} / (\ell^n \sqrt{n!})\). So the RBF kernel compares moments of every order, with weights that decrease quickly. For such characteristic kernels, \(\textrm{MMD}(P, Q) = 0\) only if \(P = Q\), so MMD is a metric (Gretton et al. 2012). The space of functions spanned by the features is the reproducing kernel Hilbert space of \(k\), the subject of (Schölkopf and Smola 2002); we need nothing from it beyond the steps above.
For Gaussians the RBF expectations have a closed form. For \(Z \sim \mathcal{N}(m, s^2)\), a Gaussian integral gives
\[ \mathbb{E}\big[e^{-Z^2/(2\ell^2)}\big] = \Big(1 + \frac{s^2}{\ell^2}\Big)^{-1/2} \exp\!\Big(-\frac{m^2}{2(\ell^2 + s^2)}\Big), \tag{28.3.14}\]
and the difference of two independent Gaussians is Gaussian with the variances added. For \(\mathcal{N}(0, 1)\) against \(\mathcal{N}(0, 4)\) at \(\ell = 1\) the three differences \(x - x'\), \(y - y'\) and \(x - y\) have variances \(2\), \(8\) and \(5\), so \(\textrm{MMD}^2 = 3^{-1/2} + 9^{-1/2} - 2 \cdot 6^{-1/2} \approx 0.094\).
From samples, each expectation in Equation 28.3.13 becomes an average over pairs. The unbiased estimator (Gretton et al. 2012) leaves out the pairs of a point with itself, whose kernel value is \(1\) and would bias the within-sample terms upward. The following cell asks what each kernel can see. It compares \(1{,}000\) draws from \(\mathcal{N}(0, 1)\) with \(1{,}000\) draws from \(\mathcal{N}(0, 4)\) under the linear, quadratic and RBF kernels, and then applies the RBF kernel to a second sample from \(\mathcal{N}(0, 1)\) and to a sample from \(\mathcal{N}(0.5, 1)\). Each estimate is printed next to its population value (the last one is derived in problem 6b).
def mmd2_unbiased(x, y, k):
    """Unbiased MMD^2 between samples x and y for the kernel k(a, b)."""
    kxx = k(x[:, None], x[None, :])
    kyy = k(y[:, None], y[None, :])
    n, m = len(x), len(y)
    return ((kxx.sum() - np.trace(kxx)) / (n * (n - 1))
            + (kyy.sum() - np.trace(kyy)) / (m * (m - 1))
            - 2 * k(x[:, None], y[None, :]).mean())

linear = lambda a, b: a * b                         # features phi(x) = x
quadratic = lambda a, b: a * b + a ** 2 * b ** 2    # features (x, x^2)
rbf = lambda a, b: np.exp(-(a - b) ** 2 / 2)        # RBF kernel, ell = 1

rng = np.random.default_rng()
n = 1000
x_p = rng.standard_normal(n)                # P = N(0, 1)
y_var = 2 * rng.standard_normal(n)          # N(0, 4)
y_same = rng.standard_normal(n)             # N(0, 1) again
y_shift = rng.standard_normal(n) + 0.5      # N(0.5, 1)
for name, y, k, pop in [
        ('linear,    N(0,1) vs N(0,4)', y_var, linear, 0.0),
        ('quadratic, N(0,1) vs N(0,4)', y_var, quadratic, 9.0),
        ('RBF,       N(0,1) vs N(0,4)', y_var, rbf,
         3 ** -0.5 + 9 ** -0.5 - 2 * 6 ** -0.5),
        ('RBF,       N(0,1) vs N(0,1)', y_same, rbf, 0.0),
        ('RBF,       N(0,1) vs N(0.5,1)', y_shift, rbf,
         2 / np.sqrt(3) * (1 - np.exp(-1 / 24)))]:
    print(f'{name:30s} MMD^2 = {mmd2_unbiased(x_p, y, k):+.4f}  '
f'(population {pop:.4f})')linear, N(0,1) vs N(0,4) MMD^2 = -0.0051 (population 0.0000)
quadratic, N(0,1) vs N(0,4) MMD^2 = +10.8151 (population 9.0000)
RBF, N(0,1) vs N(0,4) MMD^2 = +0.1144 (population 0.0942)
RBF, N(0,1) vs N(0,1) MMD^2 = -0.0007 (population 0.0000)
RBF, N(0,1) vs N(0.5,1) MMD^2 = +0.0462 (population 0.0471)linear, N(0,1) vs N(0,4) MMD^2 = -0.0045 (population 0.0000)
quadratic, N(0,1) vs N(0,4) MMD^2 = +10.7600 (population 9.0000)
RBF, N(0,1) vs N(0,4) MMD^2 = +0.1048 (population 0.0942)
RBF, N(0,1) vs N(0,1) MMD^2 = -0.0003 (population 0.0000)
RBF, N(0,1) vs N(0.5,1) MMD^2 = +0.0467 (population 0.0471)linear, N(0,1) vs N(0,4) MMD^2 = +0.0056 (population 0.0000)
quadratic, N(0,1) vs N(0,4) MMD^2 = +9.3070 (population 9.0000)
RBF, N(0,1) vs N(0,4) MMD^2 = +0.0896 (population 0.0942)
RBF, N(0,1) vs N(0,1) MMD^2 = -0.0008 (population 0.0000)
RBF, N(0,1) vs N(0.5,1) MMD^2 = +0.0553 (population 0.0471)linear, N(0,1) vs N(0,4) MMD^2 = -0.0046 (population 0.0000)
quadratic, N(0,1) vs N(0,4) MMD^2 = +8.2294 (population 9.0000)
RBF, N(0,1) vs N(0,4) MMD^2 = +0.0913 (population 0.0942)
RBF, N(0,1) vs N(0,1) MMD^2 = +0.0010 (population 0.0000)
RBF, N(0,1) vs N(0.5,1) MMD^2 = +0.0344 (population 0.0471)Each estimate lands near its population value, within the sampling error of \(1{,}000\) draws. The linear kernel reports a few hundredths at most, because the means agree. The quadratic kernel reports about \(9\), give or take \(3\); its estimate involves fourth powers and is noisy. The RBF kernel reports about \(0.094\), give or take \(0.03\). On two samples from the same distribution the RBF estimate is within a few thousandths of zero and may be slightly negative, which an unbiased estimator of zero must sometimes be. The half-standard-deviation shift gives about \(0.047\), typically within \(0.02\) of it. No critic was trained and no density was evaluated.
Where do the two samples differ? The supremum in Equation 28.3.12 is attained by \(\mathbf{w}^\star \propto \mathbf{m}_P - \mathbf{m}_Q\), and the corresponding test function, the witness, \(g^\star(x) \propto \langle \mathbf{m}_P - \mathbf{m}_Q, \boldsymbol{\varphi}(x)\rangle = \mathbb{E}_P[k(x, X)] - \mathbb{E}_Q[k(x, Y)]\), needs only kernel evaluations. The following cell estimates it with sample means on a grid for the shifted pair, plots it with the two densities, and checks that \(\mathbb{E}_P g - \mathbb{E}_Q g\) for the unscaled witness \(g\) reproduces \(\textrm{MMD}^2\).
g = lambda s: (rbf(s[:, None], x_p[None, :]).mean(axis=1)    # the unscaled
               - rbf(s[:, None], y_shift[None, :]).mean(axis=1))  # witness
grid = np.linspace(-4.0, 4.5, 400)
witness = g(grid)
print(f'witness changes sign at x = {grid[np.argmax(witness < 0)]:.2f}')
print(f'E_P g - E_Q g = {g(x_p).mean() - g(y_shift).mean():.4f}')
pdf = lambda t, mu: np.exp(-(t - mu) ** 2 / 2) / np.sqrt(2 * np.pi)
d2l.plot(grid, [witness / np.abs(witness).max(), pdf(grid, 0.0),
                pdf(grid, 0.5)], 'x', '',
         legend=['witness (scaled)', 'p = N(0, 1)', 'q = N(0.5, 1)'],
figsize=(5, 3))witness changes sign at x = 0.26
E_P g - E_Q g = 0.0470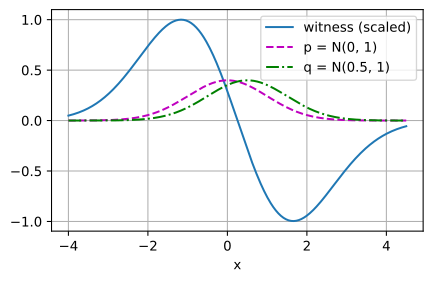
witness changes sign at x = 0.45
E_P g - E_Q g = 0.0476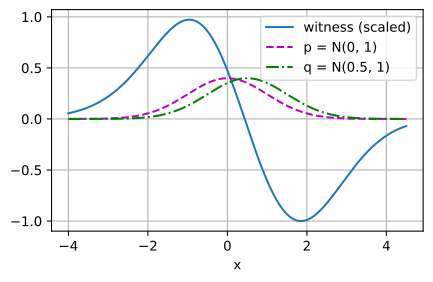
witness changes sign at x = 0.41
E_P g - E_Q g = 0.0562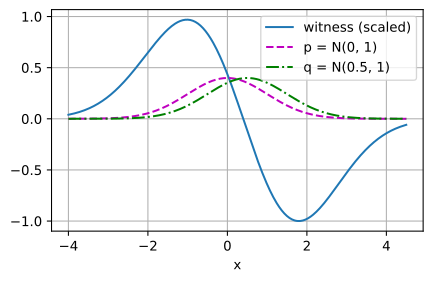
witness changes sign at x = 0.35
E_P g - E_Q g = 0.0352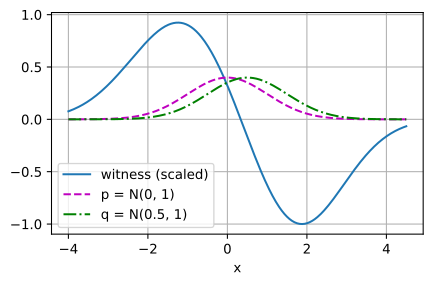
The witness is positive where \(P\) has more mass and negative where \(Q\) has more, and it changes sign near the midpoint \(x = 0.25\) of the two means (within about \(0.2\) of it, depending on the draw). The gap \(\mathbb{E}_P g - \mathbb{E}_Q g\) agrees with the printed \(\textrm{MMD}^2\) to about \(0.001\); the small difference is the self-pairs that the unbiased estimator leaves out. The witness plays the role of \(A^\star\) in Figure 28.3.3: it is the one test function that sees the whole gap. Because MMD with a fixed kernel needs only samples and no training, it serves as a kernel two-sample test and as an adversary-free training loss, as in generative moment matching networks (Li et al. 2015). MMD-GANs instead learn the kernel’s features adversarially (Li et al. 2017).
28.3.3.3 Optimal Transport and the Wasserstein Distance
Return to the point masses \(P = \delta_0\) and \(Q = \delta_d\). For every \(d \neq 0\) the supports are disjoint, so every f-divergence is the constant \(f(0) + f'(\infty)\): \(D_{\textrm{KL}} = \infty\), \(\textrm{TV} = 1\) and \(\textrm{JS} = \log 2\), whether \(d = 0.01\) or \(d = 100\). A generator early in training is in this situation, because its samples and the data occupy disjoint thin regions of image space, and an objective that does not change with the generator’s parameters supplies zero gradient. This vanishing gradient of GAN training comes from the divergence, so a better optimizer cannot remove it (Arjovsky et al. 2017).
Geometry still distinguishes distributions with disjoint supports: \(\delta_{0.01}\) is near \(\delta_0\) because its mass need only move \(0.01\). The Wasserstein-1 distance, also called the earth mover’s distance, makes this precise. A coupling \(\gamma\) of \(P\) and \(Q\) is a joint distribution of pairs \((x, y)\) whose marginals are \(P\) and \(Q\). It is a transport plan: it says how much mass travels from each source \(x\) to each destination \(y\), as in Figure 28.3.4. Writing \(\Pi(P, Q)\) for the set of couplings, for \(P\) and \(Q\) with finite first moments,
\[ W_1(P, Q) = \inf_{\gamma \in \Pi(P, Q)} \mathbb{E}_{(x, y) \sim \gamma}\big[ \|x - y\| \big]. \tag{28.3.15}\]
Thus \(W_1\) is the smallest total of mass times distance over all plans. On the point masses the only plan moves all mass from \(0\) to \(d\), so \(W_1(\delta_0, \delta_d) = |d|\): continuous and 1-Lipschitz in \(d\), with gradient \(\pm 1\) for \(d \neq 0\). This is the training signal that the f-divergences lack.

The primal problem Equation 28.3.15 optimizes over joint distributions, which are hard even to parameterize from samples. Its dual is the reason \(W_1\) matters to deep learning.
Proposition (Kantorovich–Rubinstein duality). For distributions \(P\) and \(Q\) on \(\mathbb{R}^n\) (or any complete separable metric space) with finite first moments,
\[ W_1(P, Q) = \sup_{\|g\|_{\textrm{Lip}} \leq 1} \big( \mathbb{E}_{x \sim P}[g(x)] - \mathbb{E}_{y \sim Q}[g(y)] \big), \tag{28.3.16}\]
where the supremum runs over all 1-Lipschitz functions \(g\), those with \(|g(x) - g(y)| \leq \|x - y\|\) for all \(x, y\).
We prove the statement below only on the line; Peyré and Cuturi (2019) give the general proof. One direction, weak duality, holds in general and takes two lines. For any 1-Lipschitz \(g\) and any coupling \(\gamma\), \(g(x) - g(y) \leq \|x - y\|\) at every pair. Taking the expectation under \(\gamma\) gives \(\mathbb{E}_P[g] - \mathbb{E}_Q[g] \leq \mathbb{E}_\gamma\|x - y\|\), so no test function’s gap can exceed any plan’s cost (compare the weak duality of Section 26.6.1). Thus \(W_1\) is the IPM Equation 28.3.11 over test functions with slope at most \(1\). The WGAN (Arjovsky et al. 2017) trains this dual: a neural critic plays the role of \(g\) and is constrained to be approximately 1-Lipschitz.
On the line, optimal transport needs no optimization at all. At a point \(t\), \(P\) has a fraction \(F_P(t)\) of its mass to the left of \(t\) and \(Q\) has \(F_Q(t)\), so any plan must carry at least \(|F_P(t) - F_Q(t)|\) of mass across \(t\). A parcel moved from \(x\) to \(y\) crosses every \(t\) between them, so its distance \(|x - y|\) is the length of the set of points it crosses, and the total cost is the mass crossing each \(t\), integrated over \(t\).
Proposition (\(W_1\) on the line). For distributions \(P\) and \(Q\) on \(\mathbb{R}\) with CDFs \(F_P\), \(F_Q\) and finite first moments,
\[ W_1(P, Q) = \int_{-\infty}^{\infty} \lvert F_P(t) - F_Q(t) \rvert \, dt = \sup_{\|g\|_{\textrm{Lip}} \leq 1} \big( \mathbb{E}_P[g] - \mathbb{E}_Q[g] \big), \tag{28.3.17}\]
so Kantorovich–Rubinstein duality holds on the line.
Proof. Step 1: every plan costs at least the area. For \((X, Y) \sim \gamma\), \(|X - Y| = \int \mathbf{1}[t \textrm{ lies between } X \textrm{ and } Y]\, dt\), so by Fubini’s theorem (justified by the finite first moments)
\[ \mathbb{E}_\gamma|X - Y| = \int \Big( \gamma(X \leq t < Y) + \gamma(Y \leq t < X) \Big)\, dt \geq \int \big| \gamma(X \leq t < Y) - \gamma(Y \leq t < X) \big|\, dt. \]
The step that is not routine is the difference inside the last integral. Add and subtract \(\gamma(X \leq t, Y \leq t)\): then \(\gamma(X \leq t < Y) - \gamma(Y \leq t < X) = \gamma(X \leq t) - \gamma(Y \leq t) = F_P(t) - F_Q(t)\), because the marginals of \(\gamma\) are \(P\) and \(Q\). So every plan costs at least \(\int |F_P - F_Q|\).
Step 2: one plan costs exactly the area. Let \(U\) be uniform on \((0, 1)\) and use the monotone coupling \(X = F_P^{-1}(U)\), \(Y = F_Q^{-1}(U)\), with the quantile function \(F^{-1}(\lambda) = \inf\{x : F(x) \geq \lambda\}\) for \(\lambda \in (0, 1)\), which satisfies \(F^{-1}(\lambda) \leq t\) exactly when \(\lambda \leq F(t)\). Then \(\gamma(X \leq t < Y) = \Pr\big(F_Q(t) < U \leq F_P(t)\big)\) and \(\gamma(Y \leq t < X) = \Pr\big(F_P(t) < U \leq F_Q(t)\big)\). At least one of the two is zero, so the inequality of Step 1 is an equality for this plan. Hence the primal \(W_1\) equals the area.
Step 3: no test function beats the area. This is weak duality, shown above.
Step 4: one test function attains the area. A 1-Lipschitz \(g\) is absolutely continuous with \(|g'| \leq 1\) wherever the derivative exists, and \(g(x) = g(0) + \int_0^x g'(t)\, dt\) (Folland 1999). The constant \(g(0)\) cancels in \(\mathbb{E}_P[g] - \mathbb{E}_Q[g]\). Writing \(\int_0^X g'(t)\,dt = \int_0^{\infty} g'(t)\, \mathbf{1}[X > t]\, dt - \int_{-\infty}^0 g'(t)\, \mathbf{1}[X \leq t]\, dt\) and swapping expectation and integral (Fubini’s theorem from Section 25.5),
\[ \mathbb{E}_P[g] - \mathbb{E}_Q[g] = \int_{-\infty}^{\infty} g'(t)\, \big( F_Q(t) - F_P(t) \big)\, dt. \]
The choice \(g'(t) = \textrm{sign}\big(F_Q(t) - F_P(t)\big)\) defines a 1-Lipschitz \(g\) and makes the right side equal to the area. Together, the dual is at least the area (Step 4), at most the primal (Step 3), and the primal equals the area (Steps 1 and 2). \(\blacksquare\)
Thus on the line \(W_1\) is the area between the two CDFs, the shaded region of Figure 28.3.4. For two samples of equal size it is the mean absolute difference of the sorted values (problem 10a). The running example for transport is a pair of distributions on the six points \(0, 1, \ldots, 5\): \(P\) puts most of its mass on the left and \(Q\) on the right. The following cell computes \(W_1\) twice, by the CDF formula and by solving the primal Equation 28.3.15 as a linear program over plans (a plan is a \(6 \times 6\) matrix with row sums \(p\) and column sums \(q\)).
atoms = np.array([0.0, 1.0, 2.0, 3.0, 4.0, 5.0])
p_w = np.array([0.30, 0.20, 0.25, 0.10, 0.10, 0.05])
q_w = np.array([0.05, 0.10, 0.10, 0.25, 0.20, 0.30])

F_p, F_q = np.cumsum(p_w), np.cumsum(q_w)
w1_cdf = np.sum(np.abs(F_p - F_q)[:-1] * np.diff(atoms))

C = np.abs(atoms[:, None] - atoms[None, :])      # cost matrix |x_i - y_j|
n_atoms = len(atoms)
A_eq = np.zeros((2 * n_atoms, n_atoms * n_atoms))
for i in range(n_atoms):
    A_eq[i, i * n_atoms:(i + 1) * n_atoms] = 1   # row sums    = p
    A_eq[n_atoms + i, i::n_atoms] = 1            # column sums = q
res = optimize.linprog(C.ravel(), A_eq=A_eq,
                       b_eq=np.concatenate([p_w, q_w]), method='highs')
print(f'W1 via the CDF formula : {w1_cdf:.10f}')
print(f'W1 via the primal LP   : {res.fun:.10f}')
W1 via the CDF formula : 1.7000000000
W1 via the primal LP : 1.7000000000Both routes give \(W_1 = 1.7\) to ten decimal places: one sum over five gaps replaces a \(36\)-variable linear program.
The optimal plan for the cost \(|x - y|\) need not be unique. Here \(F_P \geq F_Q\) at every atom, so all mass can move rightward, and every plan that moves mass only rightward costs \(\sum_j x_j q_j - \sum_i x_i p_i = 3.35 - 1.65 = 1.7\). All such plans are optimal, and the linear program returns one of them, not necessarily the monotone plan of the figure. For a strictly convex cost such as \((x - y)^2\) the monotone plan is the unique optimum (problem 10d).
28.3.3.4 Entropic Regularization and Sinkhorn Iterations
In more than one dimension there is in general no CDF formula, and the linear program has \(n^2\) variables for \(n\) points on each side. The standard remedy is entropic regularization (Cuturi 2013): we add the term \(\varepsilon \sum_{ij} \gamma_{ij} (\log \gamma_{ij} - 1)\) to the transport cost \(\sum_{ij} \gamma_{ij} C_{ij}\), for a cost matrix \(\mathbf{C}\) and a regularizer \(\varepsilon > 0\). On plans, \(\sum_{ij}\gamma_{ij} = 1\), so the added term is \(-\varepsilon\) times the entropy of \(\gamma\) plus a constant; it penalizes plans that concentrate on few routes.
The regularized problem has a closed-form structure. Its Lagrangian, as in Section 26.6.1, adds a multiplier \(\xi_i\) for each row-sum constraint \(\sum_j \gamma_{ij} = p_i\) and \(\zeta_j\) for each column-sum constraint \(\sum_i \gamma_{ij} = q_j\). Setting its derivative in \(\gamma_{ij}\) to zero gives \(C_{ij} + \varepsilon \log \gamma_{ij} - \xi_i - \zeta_j = 0\), so \(\gamma_{ij} = e^{\xi_i/\varepsilon}\, e^{-C_{ij}/\varepsilon}\, e^{\zeta_j/\varepsilon}\). In matrix form,
\[ \boldsymbol{\gamma}_\varepsilon = \textrm{diag}(\mathbf{a})\, \mathbf{K}\, \textrm{diag}(\mathbf{b}), \qquad \mathbf{K} = e^{-\mathbf{C}/\varepsilon} \textrm{ (entrywise)}, \tag{28.3.18}\]
with positive scalings \(\mathbf{a} = e^{\boldsymbol{\xi}/\varepsilon}\) and \(\mathbf{b} = e^{\boldsymbol{\zeta}/\varepsilon}\). Thus the regularized plan is the Gibbs kernel \(\mathbf{K}\), rescaled row by row and column by column. Only the scalings are unknown, and each half of the constraints determines one of them. With \(\mathbf{b}\) fixed, \(\mathbf{a} = \mathbf{p} / (\mathbf{K}\mathbf{b})\) (entrywise) makes the row sums equal to \(\mathbf{p}\). With \(\mathbf{a}\) fixed, \(\mathbf{b} = \mathbf{q} / (\mathbf{K}^\top \mathbf{a})\) makes the column sums equal to \(\mathbf{q}\).
The Sinkhorn iterations alternate these two updates. Each iteration costs two matrix-vector products, so the iterations run well on a GPU and can be differentiated through. They converge linearly, at a rate that worsens as \(\varepsilon \to 0\). For small \(\varepsilon\) the entries of \(\mathbf{K}\) underflow, so practical code iterates on \(\log \mathbf{a}\) and \(\log \mathbf{b}\) (problem 12b). We report the entropic cost, the transport cost \(\sum_{ij} (\gamma_\varepsilon)_{ij} C_{ij}\) of the regularized plan without the entropy term. As \(\varepsilon \to 0\) it approaches the unregularized optimum (Peyré and Cuturi 2019).
To watch the plan converge we use the squared cost \(C_{ij} = (x_i - x_j)^2\) on the six-point example. Its optimal value defines the squared Wasserstein-2 distance, \(W_2^2 = \min_{\gamma} \sum_{ij} \gamma_{ij} (x_i - x_j)^2\), and its optimal plan is unique, the monotone plan. The following cell solves the linear program for \(W_2^2\), runs Sinkhorn at three values of \(\varepsilon\), and counts the routes that carry more than \(10^{-3}\) of mass.
def sinkhorn(p, q, C, eps, iters=5000):
    """Entropic OT by Sinkhorn iterations; returns the plan and its cost."""
    K = np.exp(-C / eps)                         # the Gibbs kernel
    a = np.ones_like(p)
    for _ in range(iters):
        b = q / (K.T @ a)                        # match the column sums
        a = p / (K @ b)                          # match the row sums
    plan = a[:, None] * K * b[None, :]
    return plan, np.sum(plan * C)

C2 = (atoms[:, None] - atoms[None, :]) ** 2      # squared cost (x_i - y_j)^2
res2 = optimize.linprog(C2.ravel(), A_eq=A_eq,
                        b_eq=np.concatenate([p_w, q_w]), method='highs')
print(f'squared cost, LP optimum : {res2.fun:.4f}')
plans, eps_values = [], (2.0, 0.5, 0.1)
for eps in eps_values:
    plan, cost = sinkhorn(p_w, q_w, C2, eps)
    plans.append(plan)
    print(f'epsilon = {eps}: entropic cost = {cost:.4f}, '
          f'routes above 1e-3 = {(plan > 1e-3).sum()}')
d2l.show_heatmaps(d2l.tensor(np.stack(plans)[None]), 'destination j',
                  'source i', titles=[f'epsilon = {e}' for e in eps_values],
figsize=(9, 2.8), cmap='Blues')squared cost, LP optimum : 3.5000
epsilon = 2.0: entropic cost = 4.0649, routes above 1e-3 = 25
epsilon = 0.5: entropic cost = 3.5696, routes above 1e-3 = 14
epsilon = 0.1: entropic cost = 3.4995, routes above 1e-3 = 10
squared cost, LP optimum : 3.5000
epsilon = 2.0: entropic cost = 4.0649, routes above 1e-3 = 25
epsilon = 0.5: entropic cost = 3.5696, routes above 1e-3 = 14
epsilon = 0.1: entropic cost = 3.4995, routes above 1e-3 = 10
squared cost, LP optimum : 3.5000
epsilon = 2.0: entropic cost = 4.0649, routes above 1e-3 = 25
epsilon = 0.5: entropic cost = 3.5696, routes above 1e-3 = 14
epsilon = 0.1: entropic cost = 3.4995, routes above 1e-3 = 10
squared cost, LP optimum : 3.5000
epsilon = 2.0: entropic cost = 4.0649, routes above 1e-3 = 25
epsilon = 0.5: entropic cost = 3.5696, routes above 1e-3 = 14
epsilon = 0.1: entropic cost = 3.4995, routes above 1e-3 = 10
The linear program gives \(W_2^2 = 3.5\), so \(W_2 = \sqrt{3.5} \approx 1.87\). At \(\varepsilon = 2\) the plan spreads each source’s mass over several destinations (\(25\) of the \(36\) routes carry more than \(10^{-3}\)), and its cost, \(4.06\), is well above the optimum. At \(\varepsilon = 0.5\) the plan has \(14\) routes and costs \(3.57\). At \(\varepsilon = 0.1\) only the ten routes of the monotone plan remain, and the cost, \(3.4995\), is within \(0.001\) of the linear program. Shrinking \(\varepsilon\) sharpens the plan toward the unique optimum. The squared cost’s \(W_2\) also has a dynamical form, as the least kinetic energy needed to move one distribution into the other. Section 29.6 builds on that form.
28.3.4 Scores
An energy-based model specifies a density only up to its normalizing constant: it gives \(\tilde{p}(\mathbf{x})\), but not \(Z = \int \tilde{p}(\mathbf{x})\, d\mathbf{x}\). Without \(Z\), the likelihood, the KL divergence and every f-divergence are out of reach, and drawing samples needs a Markov chain, so even the sample-based comparisons are costly. This part compares distributions through the slopes of their log-densities, which do not depend on \(Z\).
28.3.4.1 The Score and the Fisher Divergence
The score of a distribution \(P\) with differentiable density \(p\) is the gradient of its log-density with respect to the data point:
\[ s_P(\mathbf{x}) = \nabla_{\mathbf{x}} \log p(\mathbf{x}). \tag{28.3.19}\]
In classical statistics, “score” means the gradient with respect to the parameters, \(\nabla_{\boldsymbol{\theta}} \log p_{\boldsymbol{\theta}}(\mathbf{x})\), the object behind maximum likelihood and Fisher information in Section 27.5. Here the gradient is in \(\mathbf{x}\). The score is a vector field on the sample space that points in the direction in which the density increases fastest, uphill toward the mass, as Figure 28.3.5 shows. For a Gaussian \(\mathcal{N}(\mu, \sigma^2)\) it is
\[ s(x) = -\frac{x - \mu}{\sigma^2}, \]
a spring pulling toward the mean with stiffness \(1/\sigma^2\). For a mixture \(p = \sum_k w_k\, p_k\) the chain rule gives \(s(x) = \sum_k r_k(x)\, s_k(x)\) with \(r_k(x) = w_k p_k(x) / p(x)\): each component’s spring, weighted by the posterior probability, or responsibility, that \(x\) came from that component.

The score does not depend on a normalizing constant. If \(p(\mathbf{x}) = \tilde{p}(\mathbf{x}) / Z\), then
\[ \nabla_{\mathbf{x}} \log p(\mathbf{x}) = \nabla_{\mathbf{x}} \log \tilde{p}(\mathbf{x}) - \nabla_{\mathbf{x}} \log Z = \nabla_{\mathbf{x}} \log \tilde{p}(\mathbf{x}), \]
since \(Z\) does not depend on \(\mathbf{x}\). A divergence built from scores can therefore compare an unnormalized model with data. The natural choice is the mean squared difference of the two vector fields under the data distribution, the Fisher divergence:
\[ D_{\textrm{F}}(P\|Q) = \frac{1}{2}\, \mathbb{E}_{\mathbf{x} \sim P}\!\left[ \big\| s_P(\mathbf{x}) - s_Q(\mathbf{x}) \big\|^2 \right]. \tag{28.3.20}\]
It is non-negative, and it is a divergence on distributions whose densities are positive on the same connected support. There, equal scores force \(\log p - \log q\) to be constant, and normalization makes the constant zero. For two Gaussians with equal variance \(\sigma^2\) the scores differ by the constant \((\mu_1 - \mu_2)/\sigma^2\), so \(D_{\textrm{F}} = (\mu_1 - \mu_2)^2 / (2\sigma^4)\), against the KL value \((\mu_1 - \mu_2)^2/(2\sigma^2)\) from Equation 28.3.1. The general case is problem 7a.
The mixture score needs care in code, and the following cell checks the responsibility formula against a numerical derivative of \(\log p\) for the mixture of the forward/reverse experiment.
def mix_score(x, w, mus, sigmas):
    """Score of a Gaussian mixture: responsibility-weighted component scores."""
    r = np.exp(log_components(x, w, mus, sigmas) - log_mix(x, w, mus, sigmas))
    return np.sum(r * -(x - mus[:, None]) / sigmas[:, None] ** 2, axis=0)

numeric = np.gradient(log_p(x), x)               # finite differences
gap = np.abs(mix_score(x, w, mus, sigmas) - numeric)[10:-10].max()
print(f'mixture score, max |analytic - numerical|: {gap:.2e}')
mixture score, max |analytic - numerical|: 3.52e-04The two agree to the accuracy of finite differences on this grid, a few times \(10^{-4}\).
The Fisher divergence has a blind spot, and the mixture score explains it. Take two mixtures with the same components and swapped weights, \(P_w = w\,\mathcal{N}(-m, 1) + (1 - w)\,\mathcal{N}(m, 1)\) with \(w = 0.7\) against \(w = 0.3\). Near each mode the responsibility of that mode is close to one for both mixtures, so the two scores agree. They differ only in the valley between the modes, where the responsibilities hand over, and there \(P_{0.7}\) has little mass. The following cell asks how both divergences change as the modes move apart.
xs = np.linspace(-14.0, 14.0, 14001)
w_a, w_b, unit = np.array([0.7, 0.3]), np.array([0.3, 0.7]), np.ones(2)
for m in (1.0, 3.0, 5.0):
    mus_m = np.array([-m, m])
    log_a, log_b = log_mix(xs, w_a, mus_m, unit), log_mix(xs, w_b, mus_m, unit)
    score_gap = mix_score(xs, w_a, mus_m, unit) - mix_score(xs, w_b, mus_m, unit)
    fisher = 0.5 * integrate.trapezoid(np.exp(log_a) * score_gap ** 2, xs)
    print(f'm = {m:.0f}: KL = {kl(log_a, log_b, xs):.3f} nats, '
          f'Fisher = {fisher:.1e}')
m = 1: KL = 0.184 nats, Fisher = 1.1e-01
m = 3: KL = 0.337 nats, Fisher = 7.1e-03
m = 5: KL = 0.339 nats, Fisher = 4.0e-06As the modes separate, KL settles at \(0.7 \log\tfrac{7}{3} + 0.3 \log\tfrac{3}{7} = 0.339\) nats, the divergence between the two weight vectors, while the Fisher divergence falls by more than four orders of magnitude, from about \(0.1\) to about \(4 \times 10^{-6}\). A loss built from scores cannot see how mass is divided between distant modes. Adding noise to the data fills the valley (problem 11c), which is why diffusion models perturb the data with noise before they match scores.
One obstacle remains. Equation 28.3.20 contains \(s_P\), the score of the data distribution, which we do not know. Expanding the square gives \(\tfrac12\mathbb{E}_P\|s_Q\|^2 - \mathbb{E}_P[s_Q^\top s_P]\) plus a term that does not depend on the model \(Q\), and the cross term can be removed by an integration by parts (Hyvärinen 2005). Section 29.5 carries out this integration by parts in \(d\) dimensions and derives the training loss of diffusion models from it.
28.3.4.2 Stein’s Identity
The score can also test a sample against a model. The starting point is an identity that every distribution satisfies with its own score.
Proposition (Stein’s identity). (Stein 1981) Let \(P\) have a differentiable density \(p > 0\) on \(\mathbb{R}\) with score \(s_P = (\log p)'\), and let \(g\) be differentiable with \(g(x)\, p(x) \to 0\) as \(x \to \pm\infty\), \(\mathbb{E}_P|g'| < \infty\) and \(\mathbb{E}_P|g\, s_P| < \infty\). Then
\[ \mathbb{E}_{x \sim P}\big[ g'(x) + g(x)\, s_P(x) \big] = 0. \tag{28.3.21}\]
Proof. Since \(p' = s_P\, p\), integration by parts (Section 25.5.2.3) gives
\[ \int g'(x)\, p(x)\, dx = \big[ g(x)\, p(x) \big]_{-\infty}^{\infty} - \int g(x)\, p'(x)\, dx = 0 - \int g(x)\, s_P(x)\, p(x)\, dx, \]
and both integrals converge by the moment conditions. Moving the right-hand side over is Equation 28.3.21. \(\blacksquare\)
For \(P = \mathcal{N}(0, 1)\) the score is \(s_P(x) = -x\) and the identity reads \(\mathbb{E}[g'(X)] = \mathbb{E}[X g(X)]\); with \(g(x) = x\) it gives \(\mathbb{E}[X^2] = 1\). With \(g\) equal to a model’s score \(s_\theta\) the identity reads \(\mathbb{E}_P[s_\theta s_P] = -\mathbb{E}_P[s_\theta']\), which is the integration by parts that removes the data score from the Fisher divergence.
The identity holds for a large class of \(g\) at once, and, for a rich enough class of \(g\), only for \(P\) itself. If a sample’s averages violate Equation 28.3.21 for some \(g\), the sample does not come from \(P\) (problem 7c shows that a finite class of polynomials is not rich enough). The following cell asks whether sample averages under \(\mathcal{N}(0, 1)\) obey the identity for two test functions, and prints each mean with its standard error.
rng = np.random.default_rng()
z = rng.standard_normal(1_000_000)
# Stein operator for P = N(0, 1):  (A_P g)(x) = g'(x) - x g(x)
for name, g, g_prime in [('x^3', lambda t: t ** 3, lambda t: 3 * t ** 2),
                         ('sin x', np.sin, np.cos)]:
    vals = g_prime(z) - z * g(z)
    print(f"g(x) = {name:5s}: mean of g'(Z) - Z g(Z) = {vals.mean():+.4f}, "
f'standard error {vals.std() / np.sqrt(len(z)):.4f}')g(x) = x^3 : mean of g'(Z) - Z g(Z) = -0.0070, standard error 0.0066
g(x) = sin x: mean of g'(Z) - Z g(Z) = +0.0003, standard error 0.0010g(x) = x^3 : mean of g'(Z) - Z g(Z) = -0.0002, standard error 0.0065
g(x) = sin x: mean of g'(Z) - Z g(Z) = +0.0008, standard error 0.0010g(x) = x^3 : mean of g'(Z) - Z g(Z) = -0.0036, standard error 0.0065
g(x) = sin x: mean of g'(Z) - Z g(Z) = +0.0004, standard error 0.0010g(x) = x^3 : mean of g'(Z) - Z g(Z) = +0.0041, standard error 0.0065
g(x) = sin x: mean of g'(Z) - Z g(Z) = -0.0021, standard error 0.0010Each mean is a small multiple of its standard error (about \(0.0065\) for \(x^3\) and \(0.0010\) for \(\sin x\)), usually within two, as it must be if the identity holds.
28.3.4.3 The Kernel Stein Discrepancy
One test function catches one kind of violation. As with MMD, we take the largest violation over the unit ball of a feature space, and the supremum again has a closed form. Write the Stein operator of \(P\) as \((\mathcal{A}_P g)(x) = g'(x) + s_P(x)\, g(x)\), so that Stein’s identity says \(\mathbb{E}_P[\mathcal{A}_P g] = 0\), and measure a distribution \(Q\) by \(\sup_g \mathbb{E}_Q[\mathcal{A}_P g]\).
The derivation keeps the shape of the MMD derivation. For \(g(x) = \langle \mathbf{w}, \boldsymbol{\varphi}(x) \rangle\) with \(\|\mathbf{w}\| \leq 1\) the operator acts on the features, \((\mathcal{A}_P g)(x) = \langle \mathbf{w}, \boldsymbol{\varphi}'(x) + s_P(x)\, \boldsymbol{\varphi}(x) \rangle\), and the supremum over the ball is \(\big\| \mathbb{E}_Q[\boldsymbol{\varphi}' + s_P\, \boldsymbol{\varphi}] \big\|\) by Cauchy–Schwarz. Squaring this norm leaves only inner products of features, and each of them is the kernel or one of its derivatives: \(\langle \boldsymbol{\varphi}(x), \boldsymbol{\varphi}(x') \rangle = k\), \(\langle \boldsymbol{\varphi}'(x), \boldsymbol{\varphi}(x') \rangle = \partial_x k\), \(\langle \boldsymbol{\varphi}(x), \boldsymbol{\varphi}'(x') \rangle = \partial_{x'} k\) and \(\langle \boldsymbol{\varphi}'(x), \boldsymbol{\varphi}'(x') \rangle = \partial_x \partial_{x'} k\). The resulting kernel is the Stein kernel \(k_P\) of \(P\). In \(d\) dimensions \(g\) is a vector field, the operator is \(s_P^\top g + \nabla \cdot g\), and \(k\) must be continuously differentiable in each argument. The Stein kernel is then
\[ \begin{aligned} k_P(\mathbf{x}, \mathbf{x}') = {}& s_P(\mathbf{x})^\top s_P(\mathbf{x}')\, k(\mathbf{x}, \mathbf{x}') + s_P(\mathbf{x})^\top \nabla_{\mathbf{x}'} k(\mathbf{x}, \mathbf{x}') \\ &+ \nabla_{\mathbf{x}} k(\mathbf{x}, \mathbf{x}')^\top s_P(\mathbf{x}') + \nabla_{\mathbf{x}} \cdot \nabla_{\mathbf{x}'} k(\mathbf{x}, \mathbf{x}'), \end{aligned} \tag{28.3.22}\]
where the last term is \(\sum_i \partial_{x_i} \partial_{x'_i} k\). Thus \(k_P(\mathbf{x}, \mathbf{x}')\) is the kernel between the Stein-transformed features at \(\mathbf{x}\) and \(\mathbf{x}'\): its four terms pair a score with a score, a score with a derivative (twice), and a derivative with a derivative. The squared kernel Stein discrepancy (KSD) is the average Stein kernel over two independent draws from \(Q\):
\[ \mathrm{KSD}^2(Q, P) = \mathbb{E}_{\mathbf{x}, \mathbf{x}' \sim Q}\big[ k_P(\mathbf{x}, \mathbf{x}') \big]. \tag{28.3.23}\]
A second reading gives its population value. If \(Q\) also has a score and satisfies its own Stein identity, then \(\mathbb{E}_Q[g' + s_P\, g] = \mathbb{E}_Q[g' + s_Q\, g] + \mathbb{E}_Q[(s_P - s_Q)\, g] = \mathbb{E}_Q[(s_P - s_Q)\, g]\), and the same feature argument gives
\[ \mathrm{KSD}^2(Q, P) = \mathbb{E}_{x, x' \sim Q}\big[ (s_P - s_Q)(x)\, k(x, x')\, (s_P - s_Q)(x') \big]. \tag{28.3.24}\]
So KSD is a kernel-weighted Fisher divergence that needs no sample from \(P\) and no normalizing constant. For \(Q = \mathcal{N}(0, 1)\) and the wrong model \(P' = \mathcal{N}(1, 1)\), the score difference is \(-(x - 1) - (-x) = 1\), so \(\mathrm{KSD}^2 = \mathbb{E}[k(X, X')]\) with \(X - X' \sim \mathcal{N}(0, 2)\). By Equation 28.3.14 this is \((1 + 2/\ell^2)^{-1/2} = 1/\sqrt{3} \approx 0.577\) at \(\ell = 1\).
Three properties make KSD useful. First, Equation 28.3.22 involves \(P\) only through its score, so an unnormalized model works as well as a normalized one. Second, for suitable kernels (the RBF kernel among them, under mild conditions on the score) \(\mathrm{KSD}^2(Q, P) = 0\) if and only if \(Q = P\) (Liu et al. 2016; Chwialkowski et al. 2016). Third, Equation 28.3.23 is a double expectation under \(Q\) alone, so a sample \(x_1, \ldots, x_n \sim Q\) gives the unbiased estimator
\[ \widehat{\mathrm{KSD}}^2 = \frac{1}{n(n-1)} \sum_{i \neq j} k_P(x_i, x_j), \]
the same average without self-pairs as the MMD estimator.
For the one-dimensional RBF kernel \(k(x, y) = e^{-(x-y)^2/(2\ell^2)}\) the derivatives in Equation 28.3.22 are \(\partial_y k = \frac{x-y}{\ell^2}\, k\), \(\partial_x k = -\frac{x-y}{\ell^2}\, k\) and \(\partial_x \partial_y k = \big( \frac{1}{\ell^2} - \frac{(x-y)^2}{\ell^4} \big)\, k\). The following cell asks whether the KSD flags a wrong model without sampling it. It tests one sample from \(Q = \mathcal{N}(0, 1)\) against the true model \(P = \mathcal{N}(0, 1)\), whose score is \(-x\), and against the wrong model \(P' = \mathcal{N}(1, 1)\), whose score is \(-(x - 1)\).
def ksd2_ustat(x, score, ell=1.0):
    """U-statistic KSD^2 with the RBF kernel exp(-(a-b)^2 / (2 ell^2))."""
    d = x[:, None] - x[None, :]
    k = np.exp(-d ** 2 / (2 * ell ** 2))
    dk_dx = -d / ell ** 2 * k
    dk_dy = d / ell ** 2 * k
    d2k = (1 / ell ** 2 - d ** 2 / ell ** 4) * k
    s = score(x)
    kappa = (s[:, None] * s[None, :] * k + s[:, None] * dk_dy
             + dk_dx * s[None, :] + d2k)
    n = len(x)
    return (kappa.sum() - np.trace(kappa)) / (n * (n - 1))

rng = np.random.default_rng()
x_q = rng.standard_normal(1000)          # the sample: Q = N(0, 1)
for name, s, pop in [('true model  N(0,1)', lambda t: -t, 0.0),
                     ('wrong model N(1,1)', lambda t: -(t - 1), 1 / np.sqrt(3))]:
    print(f'KSD^2 vs the {name}: {ksd2_ustat(x_q, s):+.4f}  '
f'(population {pop:.4f})')KSD^2 vs the true model N(0,1): -0.0002 (population 0.0000)
KSD^2 vs the wrong model N(1,1): +0.5687 (population 0.5774)KSD^2 vs the true model N(0,1): +0.0001 (population 0.0000)
KSD^2 vs the wrong model N(1,1): +0.5941 (population 0.5774)KSD^2 vs the true model N(0,1): -0.0008 (population 0.0000)
KSD^2 vs the wrong model N(1,1): +0.5798 (population 0.5774)KSD^2 vs the true model N(0,1): -0.0014 (population 0.0000)
KSD^2 vs the wrong model N(1,1): +0.5750 (population 0.5774)Against the true model the estimate is within about \(\pm 0.005\) of zero and may dip slightly negative; against the wrong model it is about \(0.58\), within about \(\pm 0.1\) of the population value \(1/\sqrt{3}\). The sample never changed, and \(P'\) was never sampled: the discrepancy reads the mismatch off the score. This makes KSD a goodness-of-fit test for unnormalized models (Liu et al. 2016).
28.3.5 Training Objectives and Their Divergences
Table 28.3.3 pairs common training objectives with the divergence that each one’s population optimum minimizes, what the objective needs from the model and the data, and what it reports for the two point masses of the opening, now explained row by row.
| Objective | Divergence | What it needs | Two point masses \(d\) apart | Treated in |
|---|---|---|---|---|
| maximum likelihood (autoregressive models, flows) | forward KL | model density at data points | \(\infty\) | Section 28.3.2.4 |
| variational inference, VAE posterior | reverse KL | model samples and the unnormalized target | \(\infty\) | Section 28.3.2.4 |
| original GAN at the optimal discriminator | Jensen–Shannon | samples of both, through a critic | \(\log 2\), constant | Section 28.3.2.5 |
| f-GAN | the chosen \(D_f\) | samples of both, through a critic | \(f(0) + f'(\infty)\), constant | Section 28.3.2.5 |
| WGAN | \(W_1\) | samples of both, a 1-Lipschitz critic | \(d\) | Section 28.3.3.3 |
| moment matching, two-sample tests | MMD | samples of both, no critic for a fixed kernel | \(2 - 2e^{-d^2/(2\ell^2)}\), moves for \(d\) below a few \(\ell\) | Section 28.3.3.2 |
| score matching, diffusion models | Fisher | model score, data samples | undefined (needs densities); misses mass splits between modes | Section 28.3.4.1 |
| model criticism | KSD | model score, data samples | undefined (needs a score) | Section 28.3.4.2 |
Figure 28.3.6 places the members of the table in their families. The ratio, test-function and transport families overlap: TV is both an f-divergence and an IPM, and \(W_1\) is both an IPM and a transport distance. The score-based comparisons lie outside all three.

We can now choose a divergence by what we can compute and by what the comparison must detect. We may have densities, samples of both distributions, or only a model’s score, and we may need to detect a near miss on disjoint supports, a dropped mode, or a wrong normalizer. Every sample-based number in this section, the f-GAN bound, \(\textrm{MMD}^2\) and \(\mathrm{KSD}^2\), is an estimate with an error, and the f-GAN bound is biased low. The next section uses KL to measure dependence between two variables, and Section 28.5 asks how well a divergence can be estimated from \(N\) samples at all. That section shows that no distribution-free estimate certifies more than about \(\log N\) nats.
28.3.6 Summary
To compare two distributions we must choose what to compare, and the choice decides what we must compute and what the comparison can detect. f-divergences compare the density ratio point by point, share one proof of non-negativity, agree near \(P = Q\) up to the curvature \(f''(1)\), and have a variational form, the f-GAN bound, that critics can estimate from samples. Forward KL, which maximum likelihood minimizes, covers every mode, while reverse KL, which variational inference minimizes, can settle on one. Test-function comparisons look at averages: TV is the best single-sample advantage and is bounded by \(\sqrt{D_{\textrm{KL}}/2}\), and MMD is the distance between mean features, computed from samples in closed form. Transport looks at geometry, and \(W_1\) keeps a gradient on disjoint supports, where every f-divergence is constant. Score-based comparisons never see the normalizing constant, but they cannot see how mass is split between distant modes.
28.3.7 Exercises
Generators and argument order. Each row of Table 28.3.2 is one choice of \(f\) in the template Equation 28.3.2.
- For a generator \(f\), define \(f^\diamond(u) = u\, f(1/u)\). Show that \(f^\diamond\) is convex with \(f^\diamond(1) = 0\) and that \(D_f(Q\|P) = D_{f^\diamond}(P\|Q)\). Compute \(f^\diamond\) for the KL generator \(u \log u\) and for the \(\chi^2\) generator \((u - 1)^2\), and write the divergence that the second one defines as a sum over \(x\).
- Adding \(c\,(u - 1)\) to a generator does not change the divergence. Show that \(D_f\) is symmetric whenever \(f^\diamond(u) = f(u) + c\,(u - 1)\) for some constant \(c\). Check this condition for the rows of Table 28.3.2 that are marked symmetric, and show that \(D_{f_\alpha}(Q\|P) = D_{f_{1-\alpha}}(P\|Q)\) for the generator Equation 28.3.4. Use this identity to confirm the entry of the \(\alpha\)-divergence row in the “Symmetric?” column.
- Expand Equation 28.3.3 in terms of the ratio \(u = p/q\) and recover the Jensen–Shannon generator of Table 28.3.2.
- Rényi divergence. For \(\alpha > 0\), \(\alpha \neq 1\), define \(D_\alpha(P\|Q) = \frac{1}{\alpha - 1} \log \sum_x p(x)^\alpha\, q(x)^{1-\alpha}\) (Rényi 1961). Show that \(\sum_x p^\alpha q^{1-\alpha} = 1 + \alpha(\alpha - 1)\, D_{f_\alpha}(P\|Q)\) and that \(D_\alpha\) is an increasing function of \(D_{f_\alpha}\). Deduce that \(D_\alpha \geq 0\) and that \(D_\alpha\) satisfies the data-processing inequality Equation 28.3.10. Find \(\lim_{\alpha \to 0} D_\alpha(P\|Q)\), and explain why it is \(0\) whenever \(p\) and \(q\) are positive on the same outcomes. Why does the Rényi family therefore not reach reverse KL as \(\alpha \to 0\), while \(D_{f_\alpha}\) does?
Local quadratic regime. The proposition Equation 28.3.5 bounds the gap between \(D_f\) and \(\tfrac12 f''(1)\, \chi^2\).
- Verify \(f''(1) = \tfrac{1}{4}\) for the Jensen–Shannon generator and \(f''(1) = 1\) for both KL generators. Problem 1b of Section 28.1 finds the order at which the two directions of the Gaussian KL divergence first differ. Which property of the KL and reverse-KL generators explains that order? Rerun the local-quadratic cell with \(t = 0.001\) added, and explain from the proposition’s error term the rate at which each ratio approaches \(1\).
- The total-variation generator \(\tfrac{1}{2}|u - 1|\) has no second derivative at \(1\). Let \(P_t = Q + t\,(P - Q)\) for \(t \in (0, 1]\). How do \(\textrm{TV}(P_t, Q)\) and \(\chi^2(P_t\|Q)\) scale with \(t\)? Explain from this why Pinsker’s inequality Equation 28.3.9 bounds TV by the square root of KL and not by a multiple of KL.
- Let \(P\) and \(Q\) be coins with heads probabilities \(b\) and \(b + \delta\). Use the proposition to show that \(D_{\textrm{KL}}(P\|Q) = \delta^2 / \big(2 b (1 - b)\big) + O(\delta^3)\). Problem 7a of Section 28.2 obtains the same expansion directly from the Bernoulli KL divergence. The factor \(1/\big(b(1-b)\big)\) is the Fisher information of the coin (Section 27.5). Find the limit of \(\textrm{TV}/\sqrt{D_{\textrm{KL}}/2}\) as \(\delta \to 0\), and the values of \(b\) for which Pinsker’s inequality is tight in this limit. The
#divergences-distances-pinskercell takes \(b = \tfrac{1}{2}\) and prints a ratio of \(0.999999\) at \(\delta = 10^{-3}\). Why does the ratio approach \(1\) at the rate \(\delta^2\) and not \(\delta\)?
Conjugates and critics. The f-GAN bound Equation 28.3.7 needs the conjugate \(f^*\) of the generator.
- Derive the conjugate \(f^*(t) = t + t^2/4\) of the \(\chi^2\) generator \(f(u) = (u - 1)^2\), taking the supremum over \(u \in \mathbb{R}\), and its optimal critic \(T^\star = 2(p/q - 1)\). Redo the computation over the generator’s domain \(u \in (0, \infty)\), and show that the supremum is \(t + t^2/4\) for \(t \geq -2\) and \(-1\) for \(t \leq -2\).
- Use the \(\mathbb{R}\)-conjugate. Show that for every critic \(T\) the gap between \(\chi^2(P\|Q)\) and the bound equals \(\tfrac{1}{4} \mathbb{E}_Q\big[(T - T^\star)^2\big]\). Deduce the formula \(\chi^2(P\|Q)\,(2c - c^2)\) for the critics \(T = c\,T^\star\) that the
#divergences-distances-f-gan-boundcell prints, and check the gap formula on three critics of your own. - Compute the conjugate of the total-variation generator \(f(u) = \tfrac{1}{2}|u - 1|\) over \(u \in (0, \infty)\). Show that critics with values in \([-\tfrac{1}{2}, \tfrac{1}{2}]\) suffice to maximize the bound, and conclude that TV is the IPM Equation 28.3.11 over \(\{g : \|g\|_\infty \leq \tfrac{1}{2}\}\). Which critic attains it?
Cost of dropping a mode. A model \(Q\) misses part of a data distribution \(P\).
- Let \(P = (1 - w)\, Q + w R\) with \(0 < w < 1\), where \(R\) is a distribution on a set to which \(Q\) assigns probability zero. Compute \(D_{\textrm{KL}}(P\|Q)\), \(D_{\textrm{KL}}(Q\|P)\), \(\textrm{TV}(P, Q)\) and \(d_{\mathrm{H}}^2(P, Q)\) as functions of \(w\). Which direction of KL penalizes the missing mass? How do the finite divergences behave as \(w \to 0\)?
- Now let \(P = w_1 \mathcal{N}(m_1, s^2) + w_2 \mathcal{N}(m_2, s^2)\) with separation \(\Delta = |m_2 - m_1|\), and let the model \(Q = \mathcal{N}(m_1, s^2)\) keep only the first component. Show that \(D_{\textrm{KL}}(Q\|P) \leq \log(1/w_1)\) for every \(\Delta\), with equality in the limit \(\Delta \to \infty\), and relate the limit to (a). Use the bound to explain the two reverse-KL values, \(0.356\) and \(1.202\) nats, that the
#divergences-distances-fwd-rev-klcell prints. - Assume that the components are well separated, so that almost every \(x\) has non-negligible density under at most one of them. Show that \(D_{\textrm{KL}}(P\|Q) \approx w_2 \Delta^2 / (2 s^2)
+ w_1 \log w_1 + w_2 \log w_2\). Evaluate the approximation for the mixture of the
#divergences-distances-fwd-rev-klcell, check it withkl(log_p(x), log_q(x, [-2.0, np.log(0.6)]), x), and compare it with the value \(0.558\) nats of \(D_{\textrm{KL}}(P\|Q)\) at the forward fitth_fwd.
Metrics among divergences. The last column of Table 28.3.2 records which divergences are metrics.
- Prove the triangle inequality for TV from its half-\(\ell_1\) form.
- Show that the Hellinger distance \(d_{\mathrm{H}} = \sqrt{d_{\mathrm{H}}^2}\) is the Euclidean distance between the vectors \(\big(\sqrt{p(x)}\big)_x\) and \(\big(\sqrt{q(x)}\big)_x\), so that \(d_{\mathrm{H}}\) is a metric. Find three distributions on two outcomes for which both \(d_{\mathrm{H}}^2\) and JS violate the triangle inequality.
- Use Equation 28.3.17 to show that \(W_1\) is a metric on the distributions on \(\mathbb{R}\) with finite first moments.
[code] MMD in closed form, and what data processing does not preserve. Use the Gaussian integral Equation 28.3.14 for the RBF kernel with length scale \(\ell\).
- Apply the map \(x \mapsto 2x\) to both \(P\) and \(Q\). Show from Equation 28.3.2 that no f-divergence changes under an invertible map, and that \(W_1\) doubles. Show that the RBF \(\textrm{MMD}^2\) at \(\ell = 1\) falls from \(0.047\) to \(0.036\) for \(\mathcal{N}(0, 1)\) against \(\mathcal{N}(0.5, 1)\), but rises from \(0.235\) to \(0.787\) for \(\delta_0\) against \(\delta_{0.5}\). Why does the data-processing proposition Equation 28.3.10 say nothing about MMD and \(W_1\)?
- For \(P = \mathcal{N}(0, 1)\) and \(Q = \mathcal{N}(\delta, 1)\), show that \(\textrm{MMD}^2 = \frac{2\ell}{\sqrt{\ell^2 + 2}} \big(1 - e^{-\delta^2/(2(\ell^2 + 2))}\big)\). Which length scale maximizes \(\textrm{MMD}^2\) for small shifts \(\delta\)? What happens as \(\ell \to 0\) and as \(\ell \to \infty\)?
- Evaluate the formula of (b) at \(\ell = 1\) and \(\delta = 0.5\). Recompute
mmd2_unbiasedwith the RBF kernel on \(200\) fresh pairs of samples drawn likex_pandy_shift, at \(n = 250\) and at \(n = 1000\), and compare the mean and the standard deviation of the estimates with the closed form. How does the standard deviation scale with \(n\)? Is the value that your run of the#divergences-distances-mmdcell printed within the spread?
Fisher divergence and Stein moments. The score of \(\mathcal{N}(\mu, \sigma^2)\) is \(-(x - \mu)/\sigma^2\).
- Compute the Fisher divergence Equation 28.3.20 between \(\mathcal{N}(\mu_1, \sigma_1^2)\) and \(\mathcal{N}(\mu_2, \sigma_2^2)\) in closed form, and check that it reduces to \((\mu_1 - \mu_2)^2 / (2\sigma^4)\) for equal variances. Is the Fisher divergence symmetric?
- Apply Stein’s identity Equation 28.3.21 for \(\mathcal{N}(0, 1)\) to \(g(x) = x^k\), derive the recursion \(\mathbb{E}[X^{k+1}] = k\, \mathbb{E}[X^{k-1}]\), and compute \(\mathbb{E}[X^4]\) and \(\mathbb{E}[X^6]\). What does \(g(x) = 1\) give for a general \(P\) that satisfies the conditions of the identity?
- Let \(Q\) be a distribution on \(\mathbb{R}\) with finite moments of all orders such that \(\mathbb{E}_Q[g'(X) - X g(X)] = 0\) for every polynomial \(g\). Explain why \(Q = \mathcal{N}(0, 1)\), using that the normal distribution is determined by its moments. Then let \(Q(X = 1) = Q(X = -1) = \tfrac{1}{2}\), and show that it satisfies the identity for every polynomial \(g\) of degree at most \(2\) but not for \(g(x) = x^3\). What does this imply for a goodness-of-fit test that checks the identity only on polynomials up to a fixed degree?
[code] Restricted critics. ● The bound Equation 28.3.7 is tight only when the critic class contains the optimal critic. Take the \(\chi^2\) generator with the conjugate \(f^*(t) = t + t^2/4\), and critics \(T_{\boldsymbol{\theta}}(x) = \boldsymbol{\theta}^\top \boldsymbol{\phi}(x)\) that are linear in a feature vector \(\boldsymbol{\phi}(x) \in \mathbb{R}^m\). Write \(\mathbf{m}_P = \mathbb{E}_P[\boldsymbol{\phi}]\), \(\mathbf{m}_Q = \mathbb{E}_Q[\boldsymbol{\phi}]\) and \(\boldsymbol{\Sigma} = \mathbb{E}_Q[\boldsymbol{\phi} \boldsymbol{\phi}^\top]\), assumed invertible.
- Show that the bound is a concave quadratic in \(\boldsymbol{\theta}\), maximized at \(\boldsymbol{\theta}^\star = 2 \boldsymbol{\Sigma}^{-1} (\mathbf{m}_P - \mathbf{m}_Q)\), with the value \((\mathbf{m}_P - \mathbf{m}_Q)^\top \boldsymbol{\Sigma}^{-1} (\mathbf{m}_P - \mathbf{m}_Q)\).
- For affine critics, \(\boldsymbol{\phi}(x) = (1, x)\), show that the value is \((\mathbb{E}_P[X] - \mathbb{E}_Q[X])^2 / \textrm{Var}_Q(X)\). What does the restricted bound certify for \(P = \mathcal{N}(0, 1)\) and \(Q = \mathcal{N}(0, 4)\)?
- Use the features \(\phi_k(x) = \mathrm{He}_k\big((x - \mu_Q)/\sigma_Q\big)\) for \(k = 0, \ldots, d\), where \(\mathrm{He}_k\) are the probabilists’ Hermite polynomials (
numpy.polynomial.hermite_e.hermevander) and \(\mu_Q\), \(\sigma_Q\) are the mean and standard deviation of \(Q\). Compute \(\mathbf{m}_P\), \(\mathbf{m}_Q\) and \(\boldsymbol{\Sigma}\) by quadrature on a grid, and plot the value against \(d \leq 10\) for the pairs \(\big(\mathcal{N}(1, 1), \mathcal{N}(0, 1)\big)\) and \(\big(\mathcal{N}(0, 1), \mathcal{N}(0, 4)\big)\), together with their exact divergences \(\chi^2 = e - 1\) and \(4/\sqrt{7} - 1\). For the first pair the values are partial sums of a familiar series. Explain why from the generating function \(e^{xt - t^2/2} = \sum_k \mathrm{He}_k(x)\, t^k / k!\) and the orthogonality \(\mathbb{E}[\mathrm{He}_j(Z)\, \mathrm{He}_k(Z)] = k!\, \delta_{jk}\) for \(Z \sim \mathcal{N}(0, 1)\). - For the second pair, replace the expectations by averages over \(n = 200\) samples from each distribution and fit \(\boldsymbol{\theta}^\star\) on these samples. Evaluate the bound on the same samples and on \(10^5\) fresh samples, averaged over \(200\) repetitions, for \(d \in \{2, 4, 6, 8, 10\}\). Which of the two evaluations estimates a valid lower bound on \(\chi^2\)? Why does the other one exceed the restricted value of (c) and, for large \(d\), even \(\chi^2\) itself?
Hellinger bounds and testing. ● Pinsker’s inequality is vacuous once \(D_{\textrm{KL}} > 2\). Let \(\textrm{BC}(P, Q) = \sum_x \sqrt{p(x) q(x)} = 1 - \tfrac{1}{2} d_{\mathrm{H}}^2(P, Q)\) be the Bhattacharyya coefficient.
- Prove that \(\tfrac{1}{2} d_{\mathrm{H}}^2(P, Q) \leq \textrm{TV}(P, Q)\), using \(|p - q| = |\sqrt{p} - \sqrt{q}|\,(\sqrt{p} + \sqrt{q})\).
- Prove that \(\textrm{TV}(P, Q) \leq d_{\mathrm{H}}(P, Q) \sqrt{1 - \tfrac{1}{4} d_{\mathrm{H}}^2(P, Q)}\) with the Cauchy–Schwarz inequality of Section 24.1, and rewrite the bound as \(\textrm{TV}^2 \leq 1 - \textrm{BC}^2\).
- Use Jensen’s inequality to show that \(\textrm{BC}(P, Q) \geq e^{-D_{\textrm{KL}}(P\|Q)/2}\), and conclude the Bretagnolle–Huber inequality \(\textrm{TV}(P, Q) \leq \sqrt{1 - e^{-D_{\textrm{KL}}(P\|Q)}}\) (Bretagnolle and Huber 1978; Canonne 2022). For which values of \(D_{\textrm{KL}}\) is it tighter than Equation 28.3.9?
- A test sees \(n\) independent samples, all from \(P\) or all from \(Q\), each case with probability \(\tfrac{1}{2}\). Use (c) and the additivity of KL over independent samples to show that every test errs with probability at least \(\tfrac{1}{4} e^{-n D_{\textrm{KL}}(P\|Q)}\). How many samples does an error probability of at most \(\eta\) require? Why can Pinsker’s inequality not give a bound of this kind?
[code] One-dimensional transport. ● On the real line, \(W_1\) is the area between the CDFs Equation 28.3.17.
- For two empirical distributions on samples \(x_1, \ldots, x_n\) and \(y_1, \ldots, y_n\) of equal size, use the monotone coupling of the proof to show that \(W_1 = \tfrac{1}{n} \sum_i |x_{(i)} - y_{(i)}|\), the mean absolute difference of the sorted values. Check this against the linear program of the
#divergences-distances-w1cell on two random samples of size \(7\). - Compute the sorted-sample \(W_1\) between
x_pandy_shiftand betweenx_pandy_sameof the#divergences-distances-mmdcell. Then average it over \(20\) pairs of independent samples of size \(n\) from \(\mathcal{N}(0, 1)\), for \(n \in \{10^2, 10^3, 10^4\}\), and find the rate at which it decreases. The estimate is never negative. Why does this rule out unbiasedness when \(P = Q\)? - Change
q_wto \((0.40, 0.05, 0.05, 0.10, 0.10, 0.30)\), so that the two CDFs cross, and rerun the cell. Build the test function \(g\) with \(g(0) = 0\) and slope \(\textrm{sign}\big(F_Q(t) - F_P(t)\big)\) between neighboring atoms, as in Step 4 of the proof, and check that \(\mathbb{E}_P[g] - \mathbb{E}_Q[g]\) equals the LP value. For every route \((i, j)\) that carries mass in the LP solutionres.x, compare \(g(x_i) - g(x_j)\) with \(|x_i - x_j|\). Why must the two agree on every such route for any optimal plan and any optimal test function? - Non-uniqueness. With the original
p_wandq_w, show that \(F_P \geq F_Q\) at every atom and that every plan that moves mass only rightward costs \(\sum_j x_j q_j - \sum_i x_i p_i = 1.7\). Runsinkhornwith the absolute costCat \(\varepsilon = 0.1\) and \(0.02\). How many routes carry mass? Show that the limit plan has the form \(\gamma_{ij} = a_i b_j\) for \(j \geq i\) and \(0\) otherwise, and explain why it is the plan of largest entropy among the optimal plans (use part (a) of problem 12). Why is the optimal plan unique for the squared cost?
- For two empirical distributions on samples \(x_1, \ldots, x_n\) and \(y_1, \ldots, y_n\) of equal size, use the monotone coupling of the proof to show that \(W_1 = \tfrac{1}{n} \sum_i |x_{(i)} - y_{(i)}|\), the mean absolute difference of the sorted values. Check this against the linear program of the
[code] Score blindness to mixing weights. ● Let \(P_w = w\, \mathcal{N}(-m, 1) + (1 - w)\, \mathcal{N}(m, 1)\).
- The text computes \(D_{\textrm{F}}(P_{0.7}\|P_{0.3})\) and \(D_{\textrm{KL}}(P_{0.7}\|P_{0.3})\) for \(m \in \{1, 3, 5\}\). Extend the computation to \(m \in \{1, \ldots, 6\}\). Show that the KL divergence tends to \(0.4 \log\tfrac{7}{3}\), and find the rate at which the Fisher divergence decays by fitting \(\log D_{\textrm{F}}\) against \(m^2\).
- Use the responsibility form of the mixture score to explain where the scores of \(P_{0.7}\) and \(P_{0.3}\) differ, and why the weights barely affect them. What does this imply for the mixing weights of a model fitted by score matching (Wenliang and Kanagawa 2020)?
- Add independent \(\mathcal{N}(0, \sigma^2)\) noise to samples of both mixtures, so that each component becomes \(\mathcal{N}(\pm m, 1 + \sigma^2)\). Repeat (a) at \(m = 5\) for \(\sigma \in \{0, 0.5, 1, 2\}\). How does the noise change the two divergences? Relate the result to the noise-perturbed score models of Song and Ermon (2019).
[code] Sinkhorn divergences. ●● Regularize the transport LP of the
#divergences-distances-w1cell by the divergence from the independent coupling,\[ \textrm{OT}_\varepsilon(P, Q) = \min_{\gamma}\, \sum_{i, j} \gamma_{ij} C_{ij} + \varepsilon\, D_{\textrm{KL}}\big(\gamma \,\|\, p\, q^\top\big), \]
where \(\gamma\) ranges over the plans with row sums \(p\) and column sums \(q\).
- Show that \(D_{\textrm{KL}}(\gamma \,\|\, p\, q^\top) = -H(\gamma) + H(P) + H(Q)\) for every such plan, where \(H\) denotes the entropy, so that
sinkhornreturns the minimizer. Show that \(\textrm{OT}_\varepsilon(P, Q) \to \sum_{i, j} p_i q_j C_{ij}\) as \(\varepsilon \to \infty\), and that \(\textrm{OT}_\varepsilon(P, P) > 0\) for every \(\varepsilon > 0\) unless \(P\) is a point mass. With \(C_{ij} = |x_i - x_j|\), which distribution \(P\) on the atoms minimizes \(\textrm{OT}_\varepsilon(P, Q)\) for large \(\varepsilon\)? - The Sinkhorn divergence \(S_\varepsilon(P, Q) = \textrm{OT}_\varepsilon(P, Q)
- \tfrac{1}{2} \textrm{OT}_\varepsilon(P, P)
- \tfrac{1}{2} \textrm{OT}_\varepsilon(Q, Q)\) removes this bias (Genevay et al. 2018; Feydy et al. 2019). Compute \(S_\varepsilon(P, Q)\) for
p_wandq_wwith the absolute costCat \(\varepsilon \in \{10^{-2}, 10^{-1}, \ldots, 10^3\}\). For small \(\varepsilon\), carry out the Sinkhorn updates on \(\log \mathbf{a}\) and \(\log \mathbf{b}\) withscipy.special.logsumexp. Check that \(S_\varepsilon\) approaches \(W_1\) as \(\varepsilon \to 0\) and \(\tfrac{1}{2} \mathcal{E}(P, Q)\) as \(\varepsilon \to \infty\), where \(\mathcal{E}(P, Q) = 2\mathbb{E}|X - Y| - \mathbb{E}|X - X'| - \mathbb{E}|Y - Y'|\) is the energy distance (Székely and Rizzo 2013), the expression Equation 28.3.13 with \(-|x - y|\) in place of the kernel. Derive the second limit from (a). - Discretize the mixture \(P\) of the
#divergences-distances-fwd-rev-klcell on \(61\) equally spaced points of \([-6, 6]\), and model it by a Gaussian \(Q_{\boldsymbol{\theta}}\) discretized on the same points, with log-weights normalized bylogsumexp. At \(\varepsilon = 1\), minimize \(\textrm{OT}_\varepsilon(Q_{\boldsymbol{\theta}}, P)\) and \(S_\varepsilon(Q_{\boldsymbol{\theta}}, P)\) over \(\boldsymbol{\theta} = (\mu, \log\sigma)\), and compare both fits with the Gaussian that minimizes \(W_1\) by Equation 28.3.17. How does the bias of (a) show in the fitted \(\sigma\)?
- Show that \(D_{\textrm{KL}}(\gamma \,\|\, p\, q^\top) = -H(\gamma) + H(P) + H(Q)\) for every such plan, where \(H\) denotes the entropy, so that