%matplotlib inline
from d2l import tensorflow as d2l
from IPython import display
import tensorflow as tf
tf.pi = tf.acos(tf.zeros(1)).numpy() * 2  # Define pi in TensorFlow

# Plot the probability density function for some random variable
x = tf.range(-5, 5, 0.01)
p = 0.2*tf.exp(-(x - 3)**2 / 2)/tf.sqrt(2 * tf.constant(tf.pi)) + \
    0.8*tf.exp(-(x + 1)**2 / 2)/tf.sqrt(2 * tf.constant(tf.pi))

d2l.plot(x, p, 'x', 'Density')From discrete to continuous
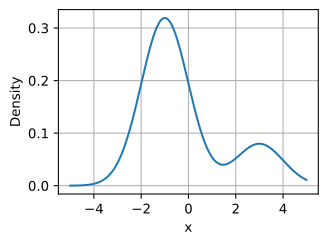
Discrete variables assign mass to points. Continuous variables assign density, and probabilities come from integrating over intervals.
PDFs
A PDF describes relative likelihood locally; only areas under the curve are probabilities, so the density itself can exceed 1.
# Approximate probability using numerical integration
epsilon = 0.01
x = tf.range(-5, 5, 0.01)
p = 0.2*tf.exp(-(x - 3)**2 / 2) / tf.sqrt(2 * tf.constant(tf.pi)) +\
    0.8*tf.exp(-(x + 1)**2 / 2) / tf.sqrt(2 * tf.constant(tf.pi))

d2l.set_figsize()
d2l.plt.plot(x, p, color='black')
d2l.plt.fill_between(x.numpy().tolist()[300:800], p.numpy().tolist()[300:800])
d2l.plt.show()

f'approximate Probability: {tf.reduce_sum(epsilon*p[300:800])}'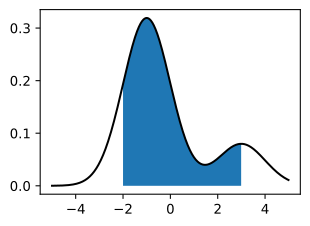
'approximate Probability: 0.7736172080039978'Standard deviation in code
Standard deviation is the square root of variance; these snippets compute both so the scale of spread stays interpretable.
# Define a helper to plot these figures
def plot_chebyshev(a, p):
    d2l.set_figsize()
    d2l.plt.stem([a-2, a, a+2], [p, 1-2*p, p])
    d2l.plt.xlim([-4, 4])
    d2l.plt.xlabel('x')
    d2l.plt.ylabel('p.m.f.')

    d2l.plt.hlines(0.5, a - 4 * tf.sqrt(2 * p),
                   a + 4 * tf.sqrt(2 * p), 'black', lw=4)
    d2l.plt.vlines(a - 4 * tf.sqrt(2 * p), 0.53, 0.47, 'black', lw=1)
    d2l.plt.vlines(a + 4 * tf.sqrt(2 * p), 0.53, 0.47, 'black', lw=1)
    d2l.plt.title(f'p = {p:.3f}')

    d2l.plt.show()

# Plot interval when p > 1/8
plot_chebyshev(0.0, tf.constant(0.2))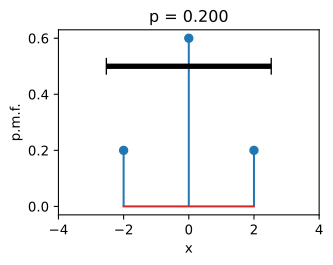
# Plot interval when p = 1/8
plot_chebyshev(0.0, tf.constant(0.125))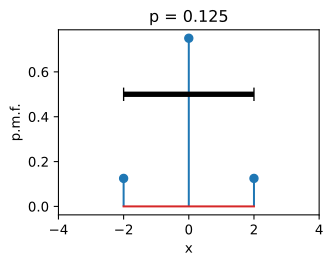
# Plot interval when p < 1/8
plot_chebyshev(0.0, tf.constant(0.05))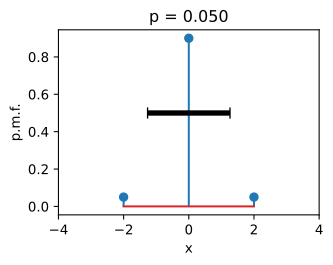
Continuous mean and variance
For continuous variables, sums become integrals: weight each value or squared deviation by its density.
# Plot the Cauchy distribution p.d.f.
x = tf.range(-5, 5, 0.01)
p = 1 / (1 + x**2)

d2l.plot(x, p, 'x', 'p.d.f.')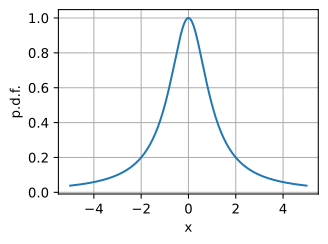
# Plot the integrand needed to compute the variance
x = tf.range(-20, 20, 0.01)
p = x**2 / (1 + x**2)

d2l.plot(x, p, 'x', 'integrand')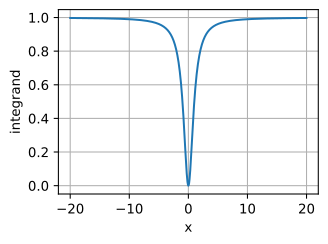
Covariance and correlation
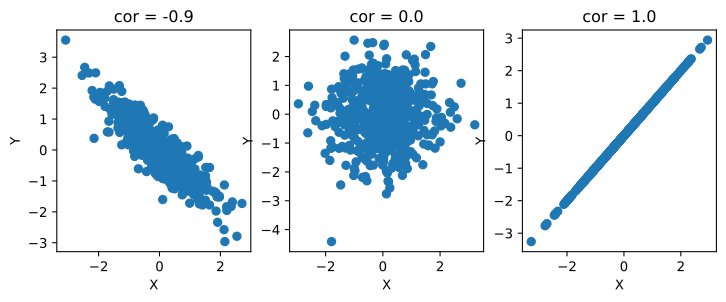
Covariance keeps the original units; correlation normalizes by standard deviations so the result lies between -1 and 1.
# Plot a few random variables adjustable covariance
covs = [-0.9, 0.0, 1.2]
d2l.plt.figure(figsize=(12, 3))
for i in range(3):
    X = tf.random.normal((500, ))
    Y = covs[i]*X + tf.random.normal((500, ))

    d2l.plt.subplot(1, 4, i+1)
    d2l.plt.scatter(X.numpy(), Y.numpy())
    d2l.plt.xlabel('X')
    d2l.plt.ylabel('Y')
    d2l.plt.title(f'cov = {covs[i]}')
d2l.plt.show()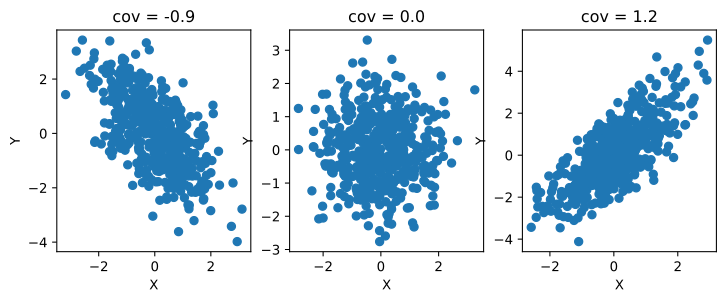
# Plot a few random variables adjustable correlations
cors = [-0.9, 0.0, 1.0]
d2l.plt.figure(figsize=(12, 3))
for i in range(3):
    X = tf.random.normal((500, ))
    Y = cors[i] * X + tf.sqrt(tf.constant(1.) -
                                 cors[i]**2) * tf.random.normal((500, ))

    d2l.plt.subplot(1, 4, i + 1)
    d2l.plt.scatter(X.numpy(), Y.numpy())
    d2l.plt.xlabel('X')
    d2l.plt.ylabel('Y')
    d2l.plt.title(f'cor = {cors[i]}')
d2l.plt.show()