The Performance Model

Same Chip, Two Orders of Magnitude Apart

One kernel — a square matmul — timed honestly at two sizes on the same GPU delivers a percent or so of peak at one size and nearly the full specification number at the other.

Explaining that gap yields the chapter’s whole toolkit:

  • a cost model you can compute with pencil and paper,
  • a measurement discipline the frameworks’ async dispatch makes non-optional,
  • a diagnosis → fix table the next six sections fill in.

Arithmetic Intensity and the Roofline

Every op asks for FLOPs and bytes. Intensity = FLOPs/byte.

\textrm{performance} \leq \min(P,\; I \cdot \beta)
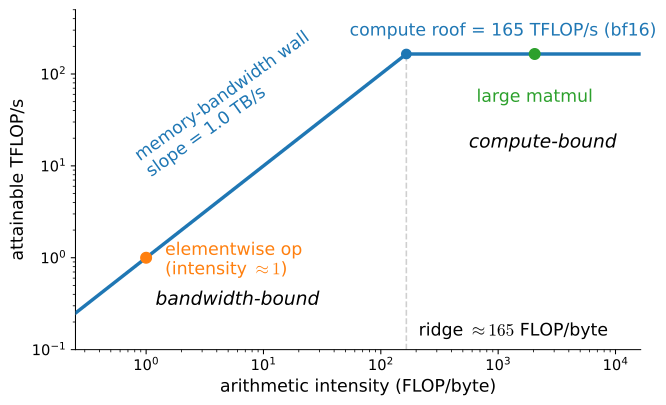
Matmul \mathbf{X}_{B\times D}\mathbf{W}_{D\times F}: intensity \approx 2B/bbatch size is intensity. Elementwise ops: intensity below 1, forever bandwidth-bound.

The Ridge Point, on Our Card

prop = torch.cuda.get_device_properties(0)
peak_tflops = 165.0   # RTX 4090 dense bf16 tensor-core spec
bandwidth_tbs = 1.008  # GDDR6X spec
print(f'{prop.name}, {prop.total_memory / 1e9:.0f} GB')
print(f'ridge point = {peak_tflops / bandwidth_tbs:.0f} FLOP/byte')
NVIDIA GeForce RTX 4090, 25 GB
ridge point = 164 FLOP/byte

~165 FLOP/byte: the machine wants about 165 ops for every byte fetched just to break even. Almost nothing you write naturally gets there. Performance work is mostly about bytes.

Timing GPUs: the Trap

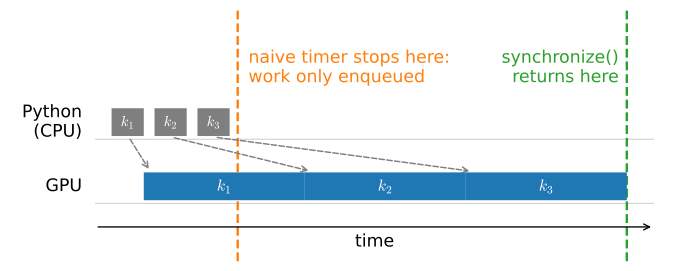
Dispatch is asynchronous — Python enqueues, the GPU runs behind.
a = torch.randn(4096, 4096, device=d2l.try_gpu(), dtype=torch.bfloat16)
b = torch.mm(a, a)  # Warmup: cuBLAS picks its kernel on first call

t0 = time.perf_counter()
for _ in range(10):
    b = torch.mm(a, a)
naive = time.perf_counter() - t0

torch.cuda.synchronize()
t0 = time.perf_counter()
for _ in range(10):
    b = torch.mm(a, a)
torch.cuda.synchronize()
honest = time.perf_counter() - t0
print(f'naive timer: {1000 * naive:.2f} ms   '
      f'with synchronize: {1000 * honest:.2f} ms')
naive timer: 0.68 ms   with synchronize: 9.17 ms

Implicit Barriers

Anything that needs a value waits for the device: .item(), .numpy(), print(x), if loss < 0.1:, nonzero().

x = torch.ones(256, 256, device=d2l.try_gpu())

torch.cuda.synchronize()
t0 = time.perf_counter()
s = 0.0
for _ in range(1000):
    y = (x * 1.01).sum()
    s += y.item()          # Reads the value: a barrier on every step
sync_every = time.perf_counter() - t0

torch.cuda.synchronize()
t0 = time.perf_counter()
s = torch.zeros((), device=d2l.try_gpu())
for _ in range(1000):
    y = (x * 1.01).sum()
    s += y                 # Accumulate on the device: no barrier
s = s.item()               # One read at the very end
sync_once = time.perf_counter() - t0
print(f'read every step: {sync_every:.3f} s   '
      f'read once: {sync_once:.3f} s')
read every step: 0.060 s   read once: 0.039 s

Rule: synchronize once per minibatch at most — and only when the host actually needs the value.

A Benchmark That Does Not Lie

Warmup (kernel selection, compilation), sync, time, sync:

class Benchmark:
    """Time a callable: warmup, then device-synchronized average seconds."""
    def __init__(self, f, warmup=3, repeats=10, desc='time'):
        self.desc = desc
        for _ in range(warmup):
            f()
        if torch.cuda.is_available():
            torch.cuda.synchronize()
        t0 = time.perf_counter()
        for _ in range(repeats):
            f()
        if torch.cuda.is_available():
            torch.cuda.synchronize()
        self.time = (time.perf_counter() - t0) / repeats

    def __repr__(self):
        return f'{self.desc}: {1000 * self.time:.2f} ms/call'

The Sweep: One Kernel, Three Regimes

sizes = [256, 512, 1024, 2048, 4096, 8192]
achieved = []
for n in sizes:
    a = torch.randn(n, n, device=d2l.try_gpu(), dtype=torch.bfloat16)
    t = Benchmark(lambda: torch.mm(a, a)).time
    achieved.append(2 * n**3 / t / 1e12)
d2l.plot(sizes, [achieved], 'matrix size $n$', 'achieved TFLOP/s',
         xscale='log', yscale='log')
print([f'{n}: {tf:.1f}' for n, tf in zip(sizes, achieved)])
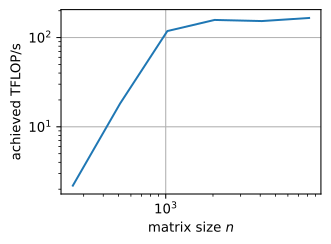
['256: 2.2', '512: 18.2', '1024: 118.3', '2048: 157.6', '4096: 153.1', '8192: 165.8']

Tiny: overhead-bound (launches rival arithmetic). Middle: a steep climb while the kernel learns to fill 128 SMs. Large: flat at the roof — compute-bound. The roofline is the ceiling; the measured knee (~2048–4096) sits well past the nominal crossover (~500) — that gap is utilization and overhead.

Diagnosis Determines the Fix
x = torch.randn(4000, 4000, device=d2l.try_gpu())
for desc, f in [('add', lambda: x + 1), ('mul', lambda: x * 1.5),
                ('sin', lambda: torch.sin(x)),
                ('sigmoid', lambda: torch.sigmoid(x))]:
    print(Benchmark(f, desc=desc))
add: 0.14 ms/call
mul: 0.14 ms/call
sin: 0.14 ms/call
sigmoid: 0.14 ms/call

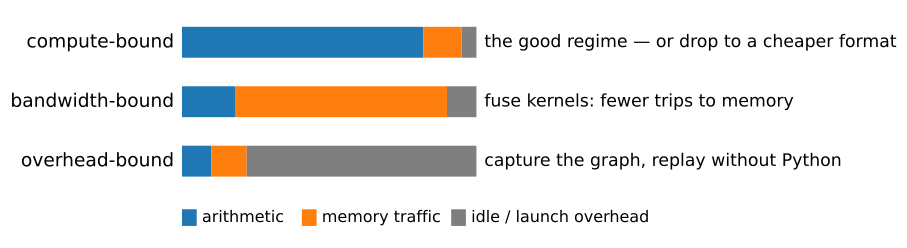
sin costs no more than add: below the ridge, memory traffic sets the time and the arithmetic hides under it.

The Method

An unfused elementwise chain pays one memory round trip per op — we measured it, we diagnosed it, and we leave it bleeding until the compiler section cures it with one line.

measure → classify → fix → re-measure

The rest of the chapter is this loop, applied: hardware explains the constants; compilation attacks bandwidth and overhead; memory and precision buy headroom; more GPUs buy more roof.