def profile_top(prof, rows=6):
    """`prof.key_averages()`, ranked as `.table()` ranks it, in the columns
    this chapter reads — and narrow enough to print on a book page."""
    avg = prof.key_averages()
    # Device time is counted on the kernel entries only. Summing over every
    # entry would count each kernel twice, once on the `aten::` op that
    # launched it, and halve every percentage.
    cuda = sum(e.self_device_time_total for e in avg
               if e.device_type != torch.autograd.DeviceType.CPU)
    cpu = sum(e.self_cpu_time_total for e in avg)
    print(f'{"":40}{"self CUDA":>10}{"%":>5}{"us/call":>9}'
          f'{"CPU total":>10}{"calls":>6}')
    for e in sorted(avg, key=lambda e: -e.device_time_total)[:rows]:
        name = e.key if len(e.key) < 40 else e.key[:36] + '...'
        print(f'{name:<40}{e.self_device_time_total / 1e3:>8.1f}ms'
              f'{100 * e.self_device_time_total / cuda:>5.1f}'
              f'{e.self_device_time_total / e.count:>9.1f}'
              f'{e.cpu_time_total / 1e3:>8.1f}ms{e.count:>6}')
    print(f'self CUDA total {cuda / 1e3:.1f}ms, '
          f'self CPU total {cpu / 1e3:.1f}ms')

opt = torch.optim.AdamW(model.parameters(), lr=1e-3)

def step_eager(X, Y):
    opt.zero_grad(set_to_none=True)
    loss = F.cross_entropy(model(X).reshape(-1, vocab_size), Y.reshape(-1))
    loss.backward(); opt.step()

for _ in range(3):
    step_eager(*next(stream))
with torch.profiler.profile(activities=[
        torch.profiler.ProfilerActivity.CPU,
        torch.profiler.ProfilerActivity.CUDA], acc_events=True) as prof:
    for _ in range(5):
        step_eager(*next(stream))
profile_top(prof)
tput0 = throughput(step_eager)
print(f'R0 eager: {tput0:.0f} tokens/s')Case Study: Optimizing a Transformer
Cumulative Optimization of a GPT
Apply the chapter’s profile–change–verify procedure to the GPT of ch. 11. Each bar changes one mechanism and inherits the previous settings.
Subject: d2l.GPT, width 512 (~19M params). Why not 256? At 256, bf16 goes backwards — matmuls too small for the tensor cores. The width choice is itself a measurement.
Profile Your Experiment First
Two traps corrupted an early draft by tens of percent:
- a ragged final batch put a
torch.compileretrace inside the timing window → keep shapes constant - the profiler’s instrumentation outlives its cell →
TEARDOWN_CUPTI=1, or profiler overhead affects later timings
The metric is end-to-end tokens/s — DataLoader and H2D included.
Baseline Profile
Classify before you fix.
                                         self CUDA    %  us/call CPU total calls
aten::mm                                    68.5ms 50.1    147.2    17.5ms   465
autograd::engine::evaluate_function:...      0.0ms  0.0      0.0    18.8ms   155
MmBackward0                                  0.0ms  0.0      0.0    16.7ms   155
aten::linear                                 0.0ms  0.0      0.0     7.6ms   155
aten::matmul                                 0.0ms  0.0      0.0     6.4ms   155
aten::mul                                   16.7ms 12.2     25.3    12.7ms   660
self CUDA total 136.6ms, self CPU total 127.3ms
R0 eager: 267436 tokens/s
Matmuls ≈ half the device time; the rest is a fusible elementwise tail, with dispatch busy most of the step. That suggests applying compilation first and reduced precision next.
Successive Optimizations
- R1 compile — fuses the tail: ~1.2× (and asserts compiled ≡ eager first)
- R2 bf16 — tensor cores, matmuls wide enough: ~1.5×
- R3 batch-up — climb the roofline: ~1.2× (fp32-512 control: bf16 bought headroom, not admission)
- R4 checkpoint — negative for speed (−~10%), but cuts peak memory ~3× (unneeded here)
big = d2l.TimeMachine(batch_size=512, num_steps=128, tokenization='char')
big_stream = batches(big)

def throughput_big(step_fn, warmup=60, timed=50):
    for _ in range(warmup):
        step_fn(*next(big_stream))
    torch.cuda.synchronize(); t0 = time.perf_counter(); n = 0
    for _ in range(timed):
        X, Y = next(big_stream); step_fn(X, Y); n += X.numel()
    torch.cuda.synchronize()
    return n / (time.perf_counter() - t0)

torch.cuda.reset_peak_memory_stats()      # control: batch 512 in fp32
for _ in range(3):
    step_eager(*next(big_stream))
mem_fp32 = torch.cuda.max_memory_allocated() / 2**30
torch.cuda.reset_peak_memory_stats()
tput3 = throughput_big(step_bf16)
print(f'R3 +batch-up (512): {tput3:.0f} tokens/s ({tput3 / tput2:.2f}x), '
      f'peak {torch.cuda.max_memory_allocated() / 2**30:.1f} GiB '
      f'(fp32 control: {mem_fp32:.1f} GiB)')
R3 +batch-up (512): 607815 tokens/s (1.25x), peak 8.6 GiB (fp32 control: 16.6 GiB)Aggregate Results
configurations = ['R0\neager', 'R1\ncompile', 'R2\n+bf16', 'R3\n+batch', 'R4\n+ckpt']
tputs = [tput0, tput1, tput2, tput3, tput4]
print(f'cumulative, R0 -> R3: {tputs[3] / tputs[0]:.2f}x')
d2l.plt.figure(figsize=(6, 3.5))
bars = d2l.plt.bar(configurations, [t / 1e3 for t in tputs],
                   color=['#7f7f7f', '#1f77b4', '#1f77b4', '#2ca02c', '#d62728'])
d2l.plt.ylabel('throughput (k tokens/s)')
d2l.plt.title('Making a Transformer fast: cumulative configurations')
for b, t in zip(bars, tputs):
    d2l.plt.text(b.get_x() + b.get_width() / 2, t / 1e3,
                 f'{t / tputs[0]:.1f}x', ha='center', va='bottom')
d2l.plt.show()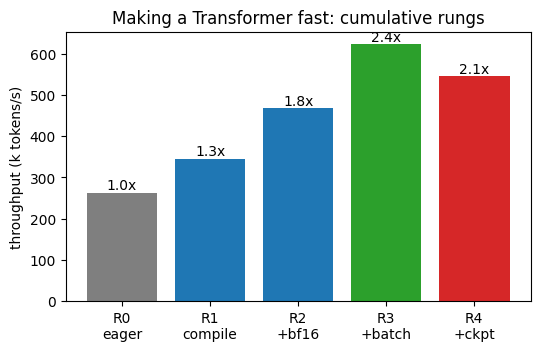
cumulative, R0 -> R3: 2.27xEach bar inherits every preceding choice. Three moderate improvements combine to give a little over 2× throughput. Checkpointing is red: a technique that helped a different model hurts this one. A 300-step run confirms the fast configuration still learns.
Predict, Then Measure: Data Parallel
Transformer params ∝ compute ⇒ ~76 MB of gradients per step with little compute to hide them. The cost model (§13.5) gives a no-overlap floor; DDP’s bucketing buys back some overlap.
n_bytes = 4 * sum(p.numel() for p in model.parameters())
beta = 4.5e9   # NCCL allreduce, effective bytes/device/s on this box (13.5)
t_comm, t_cmp = 2 * n_bytes / beta, 64 * 128 / tput0
print(f'per step: t_comm ~ {1e3 * t_comm:.0f} ms vs '
      f't_compute ~ {1e3 * t_cmp:.0f} ms')
torch.cuda.empty_cache()               # hand the ranks the parent's cache
for k in (k for k in (2, 4) if k <= d2l.num_gpus()):
    floor = k * 64 * 128 / (t_cmp + t_comm)
    meas = ddp_gpt_tokens(k)
    print(f'R5 k={k}: no-overlap floor {floor / 1e3:.0f}k tokens/s, '
          f'measured {meas / 1e3:.0f}k ({meas / tput0:.2f}x of one GPU)')
per step: t_comm ~ 34 ms vs t_compute ~ 31 ms
R5 k=2: no-overlap floor 255k tokens/s, measured 297k (1.11x of one GPU)
R5 k=4: no-overlap floor 510k tokens/s, measured 454k (1.70x of one GPU)Measured throughput is near the predicted floor: slightly above it at k=2 because of overlap and slightly below it at k=4 because the host-staged fabric provides less bandwidth. NVLink changes the constant, not the method.
Further Optimization Techniques
modded-nanoGPT’s speedrun = this chapter’s contents stacked to the ceiling: compiled kernels, FlashAttention, a better optimizer (Muon), fp8. Each record a new configuration.
measure → classify → fix → re-measure. Two budgets, three regimes, one loop — now shown on a real model, seven sections deep.