from d2l import torch as d2l
import torchThe seq2seq encoder squashes the entire source into one fixed-size vector — no matter the sentence length. Works for short sentences, breaks for long ones.
A database is a set of (\text{key}, \text{value}) pairs; a query retrieves the matching value. Attention is the differentiable, soft version:
\text{Attention}(\mathbf{q}, \mathcal{D}) = \sum_{i=1}^{m} \alpha(\mathbf{q}, \mathbf{k}_i) \mathbf{v}_i.
Sharp \alpha → database lookup; uniform \alpha → average pooling. Everything in between is attention.
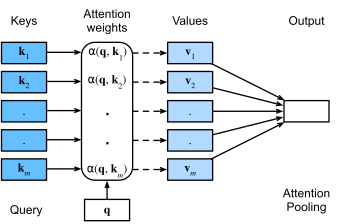
Attention pooling: linear combination of values, weights from query–key compatibility.
Most often we want \alpha to be a convex combination — non- negative and sum to one. Pick any scoring function a(\mathbf{q}, \mathbf{k}) and softmax it:
\alpha(\mathbf{q}, \mathbf{k}_i) = \frac{\exp(a(\mathbf{q}, \mathbf{k}_i))}{\sum_j \exp(a(\mathbf{q}, \mathbf{k}_j))}.
Differentiable, easy to batch, and available in every framework. But saturated logits give tiny gradients, so score scaling and masking details matter. The rest of the chapter is about choices for a and what to put in \mathbf{q}, \mathbf{k}, \mathbf{v}.
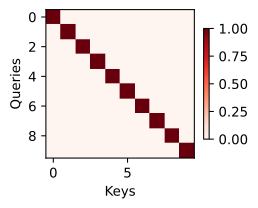
Visualizing attention weights as a (queries × keys) heatmap is the standard diagnostic. We’ll need it in every section ahead, so package it now:
def show_heatmaps(matrices, xlabel, ylabel, titles=None, figsize=(2.5, 2.5),
cmap='Reds'):
"""Show heatmaps of matrices."""
d2l.use_svg_display()
num_rows, num_cols, _, _ = matrices.shape
fig, axes = d2l.plt.subplots(num_rows, num_cols, figsize=figsize,
sharex=True, sharey=True, squeeze=False)
for i, (row_axes, row_matrices) in enumerate(zip(axes, matrices)):
for j, (ax, matrix) in enumerate(zip(row_axes, row_matrices)):
pcm = ax.imshow(d2l.numpy(matrix), cmap=cmap)
if i == num_rows - 1:
ax.set_xlabel(xlabel)
if j == 0:
ax.set_ylabel(ylabel)
if titles:
ax.set_title(titles[j])
fig.colorbar(pcm, ax=axes, shrink=0.6);Identity attention — each query picks the matching key: