On-Policy, Off-Policy, and Offline Learning

Dive into Deep Learning · §15.6

Which data may drive which update
on-policy and off-policy targets · learning from a fixed dataset · measuring overestimation · count-based pessimism

Data Reuse Depends on the Target Expectation

The quantity estimated by an update determines which data may be used.

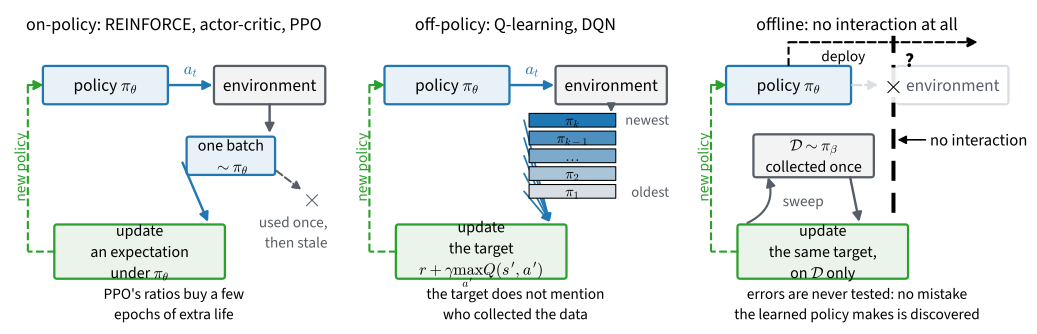
  • On-policy methods estimate an expectation under the current policy. Data from another policy require a change-of-measure correction. PPO uses this correction for a few epochs, and V-trace uses truncated corrections for moderately stale actor data.
  • Off-policy methods use a target such as r+\gamma\max_{a'}Q(s',a') that does not depend on the behavior policy. Experience replay exploits this property at scale.
The SARSA Update

\delta_{\textrm{SARSA}} = r + \gamma\, Q(s', a') - Q(s, a)

Bootstrap on the action actually taken: the fixed point becomes Q^{\pi_e}, the behavior’s value, exploration and all. On-policy.
def td_control(seed, env, num_episodes, epsilon, on_policy):
    """Q-learning and SARSA in one loop: they differ in a single symbol."""
    rng = np.random.default_rng(seed)
    Q, visits = np.zeros((16, 4)), np.zeros((16, 4))
    env.reset(seed=seed)
    for _ in range(num_episodes):
        s, done = env.reset()[0], False
        a = d2l.epsilon_greedy(Q[s], epsilon, rng)
        while not done:
            s2, r, terminated, truncated, _ = env.step(a)
            a2 = d2l.epsilon_greedy(Q[s2], epsilon, rng)
            target = Q[s2, a2] if on_policy else Q[s2].max()  # the symbol
            visits[s, a] += 1
            Q[s, a] += (r + gamma * (1 - terminated) * target
                        - Q[s, a]) / (1 + 0.1 * visits[s, a])
            s, a, done = s2, a2, terminated or truncated
    return Q

Q_q = td_control(0, env, 8000, epsilon, on_policy=False)
Q_sarsa = td_control(0, env, 8000, epsilon, on_policy=True)
d2l.show_grid(env.unwrapped.desc, np.stack([Q_q.max(-1), Q_sarsa.max(-1)]),
              np.stack([Q_q.argmax(-1), Q_sarsa.argmax(-1)]),
              titles=['Q-learning, epsilon = 0.3', 'SARSA, epsilon = 0.3'])

Two Tables, Two Questions

Q-learning: greedy policy succeeds 72.5%; the behavior earns 0.061
            the policy-weighted table value sum_a pi(a|s0) Q(s0, a) claims 0.180
     SARSA: greedy policy succeeds 74.1%; the behavior earns 0.070
            the policy-weighted table value sum_a pi(a|s0) Q(s0, a) claims 0.061
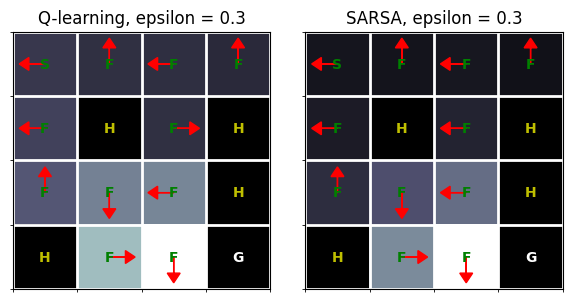
  • Q-learning estimates 0.182 at the start, close to V^* = 0.180. This estimate describes the greedy policy, not the exploratory behavior that generated the data; the latter earns roughly one third as much.
  • SARSA’s table, read policy-weighted as \sum_a \pi_e(a \mid s_0)\, Q(s_0, a), claims 0.061 against the observed return 0.070. Every entry therefore includes the effect of \epsilon-greedy exploration.
  • The two tables select nearly the same actions, within sampling error, but estimate returns under different policies.

Offline Learning without New Data

A fixed dataset permits no further interaction. Improving on the behavior policy requires estimating returns for actions that it rarely took. A learned policy may then prefer actions whose values are based on the least data, a form of distribution shift.

An inflated value cannot be corrected by a new trial. Moreover, maximization selects positive estimation errors, and bootstrapping can propagate them to earlier states.

Distribution Shift, Measured

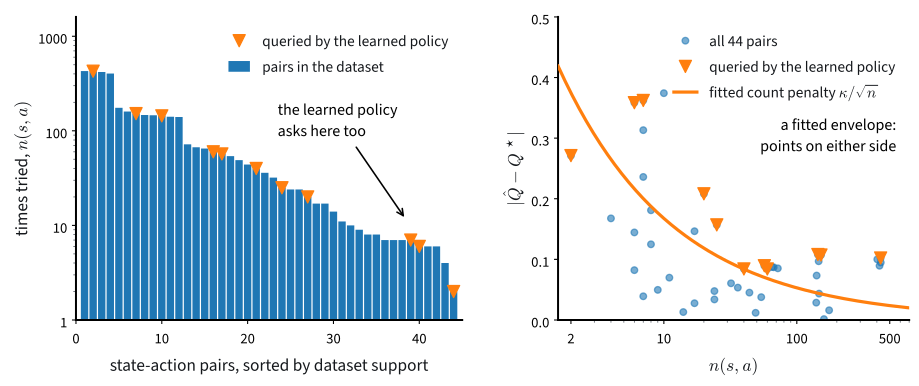
The greedy policy often selects state–action pairs from the low-count tail. The fitted penalty \kappa/\sqrt{n} is only a descriptive envelope for the observed errors; their nonzero floor is not explained by counts alone.

Three Arms, Fifteen Datasets

Naive offline Q-learning, its pessimistic variant at \kappa = 0.1, and the behavior clone of :numref:sec_imitation, each evaluated by its predicted value and its realized return.

      naive: predicted median 0.274, spread 0.185 to 0.388
             actual    median 0.097, spread 0.070 to 0.184
pessimistic: predicted median 0.121, spread 0.035 to 0.225
             actual    median 0.080, spread 0.050 to 0.189
      clone: predicted median 0.007, spread 0.004 to 0.014
             actual    median 0.008, spread 0.003 to 0.014
promises above V*(s0): naive on 15 of 15 datasets, pessimistic on 2 of 15
pessimism delivered the better policy on 4 of 15 datasets

Overestimation and Pessimism

  • Naive: median predicted value 0.274, above the optimum 0.180 on all fifteen datasets; median realized return 0.097.
  • Pessimistic: median predicted value 0.121; calibrated on all but two datasets. The policy is no better (ahead on only 4 of 15).
  • Clone: predicted value 0.007 and realized return 0.008. Its estimate is calibrated, but its policy achieves little reward.

Pessimism improves value calibration here but does not improve policy return; the naive method beats the clone tenfold: the dataset knew more than its collector used.

Optimism and Pessimism

During online interaction, an optimistic estimate directs the agent toward the corresponding action and thereby produces evidence that can correct the estimate. An offline dataset provides no such feedback, so conservative methods instead bias uncertain values downward.

\textrm{UCB: } \hat{\mu} + \kappa\sqrt{\log t / n} \qquad \textrm{offline: } \hat{Q} - \kappa/\sqrt{n}

Both formulas use an uncertainty radius that decreases with the sample count, but with opposite signs. The online bonus contains \log t so that an action can become attractive again as time passes; an offline dataset has no corresponding time index.

Beyond the Gridworld

  • Constrain the policy: BCQ restricts actions to those supported by the data. Its tabular analogue changed nothing in this experiment because zero initialization already supplies the lower bound; the difficulty is sparse, rather than entirely absent, support.
  • Constrain the values: CQL pushes down out-of-data actions; IQL never queries them; TD3+BC just adds a cloning term.
  • Drop the bootstrap: Decision Transformer conditions a sequence model on desired return, avoiding both maximization and temporal-difference bootstrapping. The contribution of the transformer architecture itself remains an empirical question.
  • Model selection without a simulator remains an important open problem.

Recap

  • The quantity being estimated determines which data may be used. SARSA evaluates the behavior policy, whereas Q-learning targets greedy continuation.
  • Offline = off-policy at its limit, minus self-correction.
  • The naive predicted value exceeded the computable optimum on all 15 datasets, while its realized return was roughly one third of that estimate.
  • The clone is the mandatory baseline: calibrated and weak here.
  • a count-shrinking radius: added online (UCB, with its \log t), subtracted offline as \kappa/\sqrt{n}; the sign is set by whether the loop is open.
  • At scale: constrain policy or values, or model sequences instead.